CHK Power Quality Pty Ltd, User Manual
–
Miro Power Quality Logger and Analyser, 15 August 2016
Website:
; Enquiries:
Page 129
Address:
Unit 1, 3 Tollis Place, Seven Hills, NSW 2147, Sydney, Australia;
ABN:
53 169 840 831;
Telephone:
+61 2 8283 6945;
Fax:
+61 2 8212 8105;
Website:
5.9.5.4 Trace selection
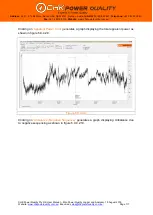
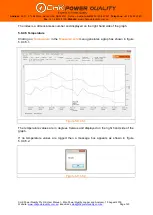
The user is able to remove or add any trace from the graph by repeatedly clicking on the
trace legend. The legend of deselected traces changes to a faint grey. Figure 5.9.5.4.1
shows only phase A voltage and current traces.
Figure 5.9.5.4.1
5.9.5.5 Reload button
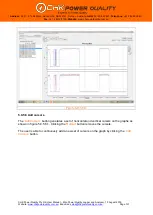
The
‘
Reload
’
button updates the graph to the default selected event graph without having to
reselect the event. This feature allows the user to quickly update the graph after visual
configurational changes.
5.9.5.6 Voltage as % of nominal
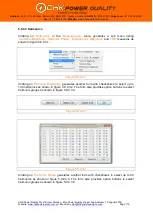
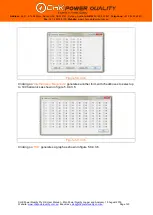
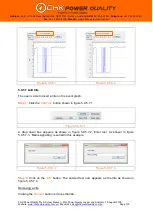
The voltage axis can be scaled as voltage amplitude or as a percentage of the nominal
voltage depending upon the setting of the
‘
V as % of Nominal (230)
’
checkbox as illustrated
by figures 5.9.5.6.1 and 5.9.5.6.2. The number in the brackets reflects the setting for the
nominal voltage. In this case it is 230V.


