CHK Power Quality Pty Ltd, User Manual
–
Miro Power Quality Logger and Analyser, 15 August 2016
Website:
; Enquiries:
Page 143
Address:
Unit 1, 3 Tollis Place, Seven Hills, NSW 2147, Sydney, Australia;
ABN:
53 169 840 831;
Telephone:
+61 2 8283 6945;
Fax:
+61 2 8212 8105;
Website:
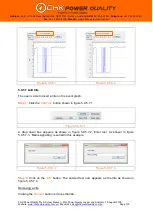
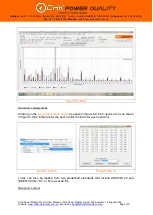
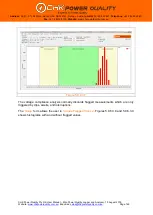
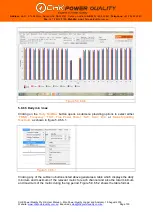
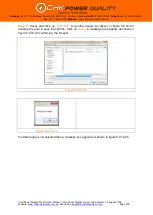
Figure 5.9.6.3.2
The voltage values for the
‘Lower
Limit
’
,
‘Upper
Limit
’
,
‘Lower
Preferred
’
and
‘Upper
Preferred
’
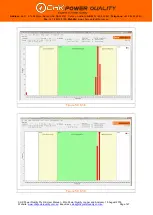
set the two regions on the graph.
The percentiles are calculated for voltages that exceed the
‘Threshold’
voltage and therefore
useful in discarding from the analysis voltages below the threshold.
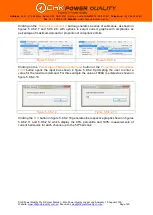
Clicking on the
’OK’
button automatically saves the profile with the current
‘
Profile Name
’
.
The user is able to load a profile by clicking on the
‘Load Previous’
button. A list box appears
allowing the user to select a profile. The name of the selected profile appears to the right of
the
‘Profile Name’
label.
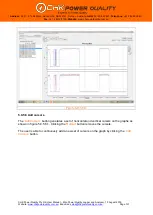
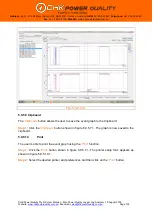
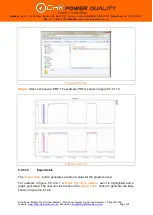
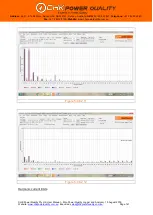
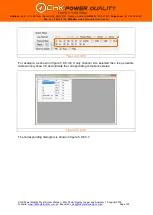
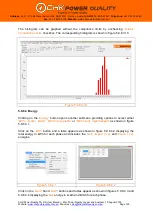
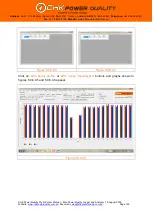
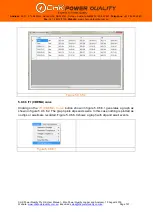
As shown in figure 5.9.6.3.3 the
‘
Percentile Table
’
summaries key statistical metrics and
indicate if the metrics are in or out of compliance (above or below the upper and lower
limits).


