CHK Power Quality Pty Ltd, User Manual
–
Miro Power Quality Logger and Analyser, 15 August 2016
Website:
; Enquiries:
Page 102
Address:
Unit 1, 3 Tollis Place, Seven Hills, NSW 2147, Sydney, Australia;
ABN:
53 169 840 831;
Telephone:
+61 2 8283 6945;
Fax:
+61 2 8212 8105;
Website:
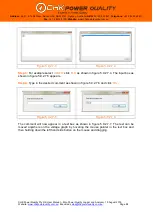
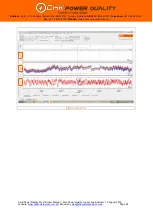
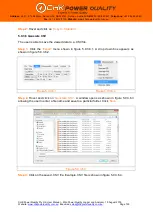
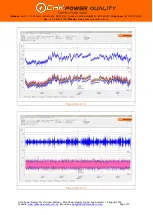
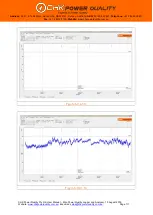
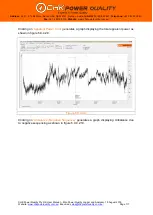
Figure 5.9.3.2.4
5.9.3.3 Generate PNG
The user is able to convert the graph in to a PNG. Follow the steps outlined in section
5.9.3.2, but select the
‘Generate P
NG
’
button rather than the
‘Generate
’
button.
5.9.3.4 Generate SVG
The user is able to convert the graph in to a SVG. Follow the steps outlined in section
5.9.3.2, but select the
‘Generate
SVG
’
button rather than the
‘Generate
’
button.
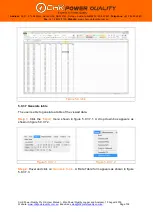
5.9.3.5 Copy to clipboard
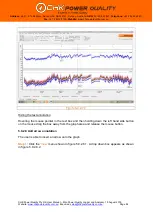
The user is able to copy a graph to the Clipboard.
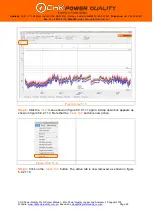
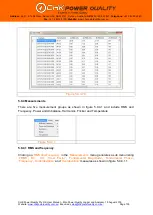
Step 1:
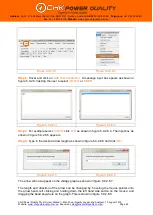
Click the
’Export’
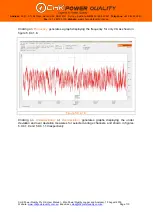
menu shown in figure 5.9.3.5.1. A drop down box appears as
shown in figure 5.9.3.5.2.
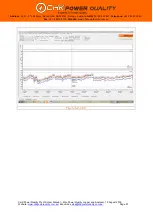
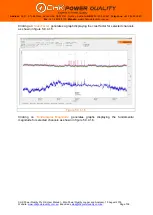
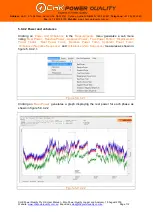
Figure 5.9.3.5.1
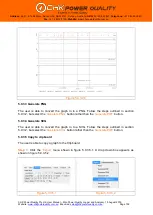
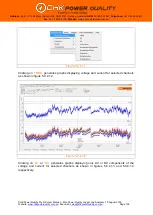
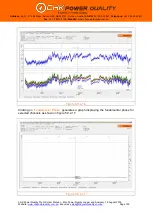
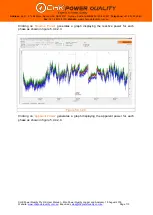
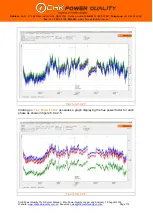
Figure 5.9.3.5.2

