CHK Power Quality Pty Ltd, User Manual
–
Miro Power Quality Logger and Analyser, 15 August 2016
Website:
; Enquiries:
Page 69
Address:
Unit 1, 3 Tollis Place, Seven Hills, NSW 2147, Sydney, Australia;
ABN:
53 169 840 831;
Telephone:
+61 2 8283 6945;
Fax:
+61 2 8212 8105;
Website:
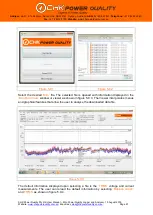
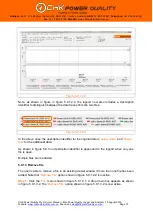
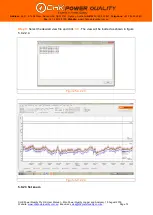
Figure 5.9.1.1.3
Method 2
The user is able to double click on a
‘Miro’
file, located in any folder, which then opens the
file viewer window. The user is able to open multiple windows from the same or different
data files. The file viewer automatically graphs the file data to display Volts/Amps as shown
in figure 5.9.3.
5.9.1.2 Add file
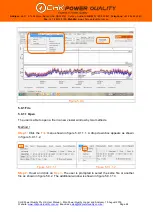
The user is able to add a file to an existing viewer window.
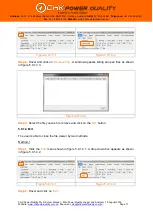
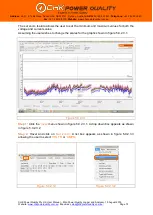
Step 1:
Click the
’File’
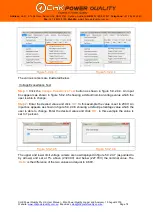
menu shown in figure 5.9.1.2.1. A drop down box appears as shown
in figure 5.9.1.2.2.
Figure 5.9.1.2.1
Figure 5.9.1.2.2
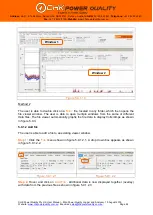
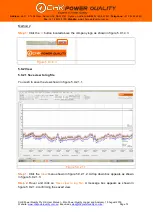
Step 2:
Hover and click on
’
Add File
’
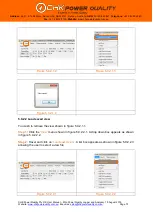
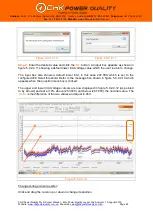
. Additional data is now displayed together (overlay)
with data from the previous file as shown in figure 5.9.1.2.3.
Window 2
Window 1


