background image


CHK Power Quality Pty Ltd, User Manual 

 Miro Power Quality Logger and Analyser, 15 August 2016 

Website

www.chkpowerquality.com.au

Enquiries: 

sales@chkpowerquality.com.au


Page 77 


Address:

 Unit 1, 3 Tollis Place, Seven Hills, NSW 2147, Sydney, Australia; 

ABN:

 53 169 840 831; 

Telephone:

 +61 2 8283 6945; 

Fax:

 +61 2 8212 8105; 

Website:

 www.chkpowerquality.com.au


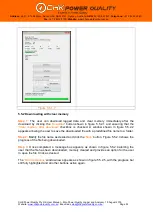
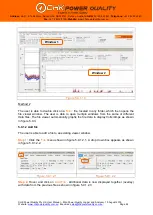
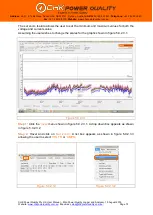
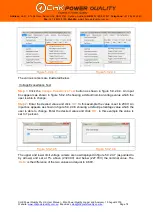
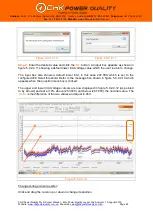
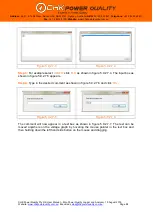
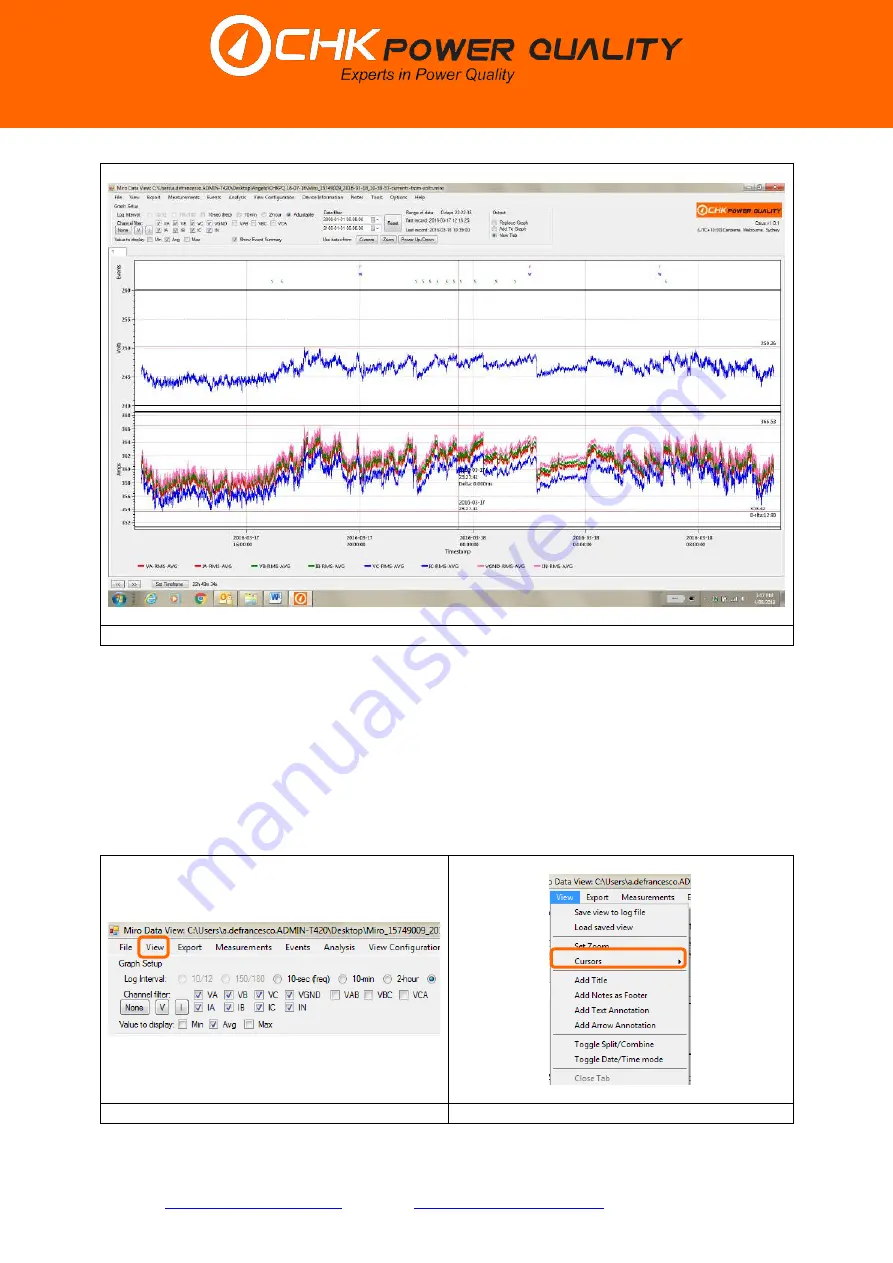
Figure 5.9.2.3.6


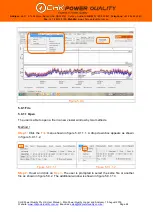
5.9.2.4 Cursors 

 
The user is able to insert cursors for voltage and current graphs. 
 

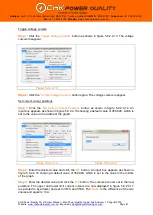
Step 1:

 Click the 

’View’

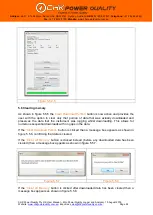
 menu shown in figure 5.9.2.4.1. A drop down box appears as shown 

in figure 5.9.2.4.2.  


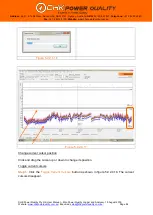
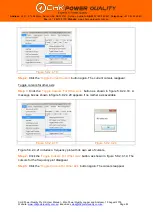
Step 2: 

Hover and click on 

’Cursors’

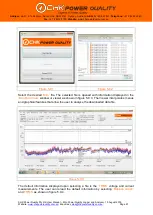
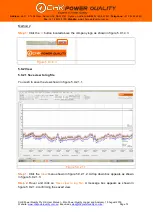
. A submenu apears listing the various available cursors 

as shown in figure 5.9.2.4.3. 


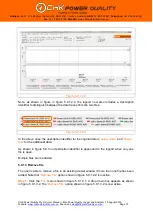
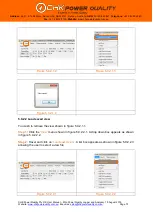
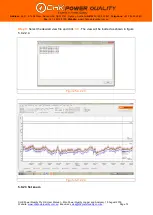
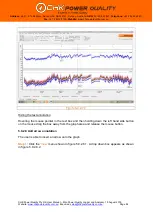
Figure 5.9.2.4.1


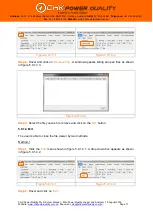
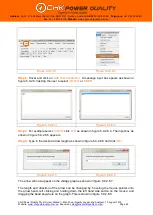
Figure 5.9.2.4.2


Summary of Contents for MIRO PQ25

Page 1: ... chkpowerquality com au Enquiries sales chkpowerquality com au Page 1 Address Unit 1 3 Tollis Place Seven Hills NSW 2147 Sydney Australia ABN 53 169 840 831 Telephone 61 2 8283 6945 Fax 61 2 8212 8105 Website www chkpowerquality com au MIRO Power Quality Logger and Analyser MODELS PQ25 35 45 User Manual ...

Page 2: ...m monitoring 9 1 1 1 10 Model category 9 1 1 1 11 Expansion port 9 1 1 1 12 Accessories 9 1 1 2 Connections and interfaces 9 1 2 Kits and accessories 11 1 2 1 PQ25 35 45 kits 11 1 2 2 Instruments 11 1 2 3 Accessories 11 1 2 3 1 Current sensors and converters 12 1 2 3 2 Voltage leads and attachments 12 1 2 3 3 Other 13 1 3 Power options 13 1 4 Internal backup battery 13 2 EQUIPMENT MAINTENANCE 14 2...

Page 3: ...er 35 5 3 14 Events 36 5 3 14 1 No events 36 5 3 14 2 Listed events 37 5 3 14 3 Event information 37 5 3 14 4 Trace selection 38 5 3 14 5 Zooming 39 5 3 14 6 Examples of RMS and Mains Signalling events 40 5 3 14 7 Examples of Coupled Mains Signalling RMS events 42 5 3 14 8 Combining charts 44 5 3 15 Waveforms 45 5 4 Configuration 47 5 4 1 General 48 5 4 1 1 Configuration description 48 5 4 1 2 Res...

Page 4: ...lian mobile phone networks band summary 59 5 4 11 2 Cellular module 59 5 4 11 3 Cellular option outside Australia 59 5 5 Downloading and clearing memory 60 5 5 1 Downloading data 60 5 5 2 Downloading with clear memory 63 5 6 Clearing memory 65 5 7 Set time 66 5 8 Firmware update 66 5 9 Miro data viewer 66 5 9 1 File 68 5 9 1 1 Open 68 5 9 1 2 Add file 69 5 9 1 3 Remove file 70 5 9 1 4 Exit 71 5 9 ...

Page 5: ...ursors 131 5 9 5 9 Clipboard 132 5 9 5 10 Print 132 5 9 5 11 Export PDF 133 5 9 5 12 Export table 134 5 9 6 Analysis 136 5 9 6 1 Harmonic average 136 5 9 6 2 Harmonic compliance 137 5 9 6 3 Voltage compliance 142 5 9 6 4 Energy 148 5 9 6 5 Daily min max 150 5 9 6 6 ITI CBEMA curve 151 5 9 7 View Configuration 153 5 9 7 1 Multiple configurations 153 5 9 8 Device information 154 5 9 9 Notes 154 5 9 ...

Page 6: ...tenance 178 7 6 Cleaning and decontamination 178 8 INSTRUMENT SPECIFICATIONS 180 8 1 Hardware specifications 180 8 2 Software features 183 9 ACCESSORIES 184 9 1 Voltage leads 184 9 1 1 Single phase leads 184 9 1 2 Three phase leads 184 9 1 3 PQ35 three phase leads 185 9 1 3 1 VL3 185 9 1 3 2 VL4 185 9 1 3 3 VL4 voltage lead attachments 186 9 1 3 4 VL6 187 9 1 4 PQ45 three phase leads 188 9 1 4 1 V...

Page 7: ...e 206 11 1 1 Three phase 4 wire Wye source with Wye load VL4 cable 206 11 1 2 Three phase 4 wire Wye source with Wye load VL5 cable 207 11 1 3 Three phase 4 wire Wye source with Wye load VL6 cable 208 11 2 Delta 209 11 2 1 Three phase 3 wire Delta source with Delta load VL3 cable 209 11 2 2 Three phase 3 wire Delta source with Delta load VL6 cable 210 11 2 3 Three phase 3 wire Delta source with De...

Page 8: ...ing 1 1 1 Feature summary 1 1 1 1 Scientific grade Designed to Class A IEC61000 4 30 1 1 1 2 Compact design The MIRO PQ is designed to meet applications for the modern marketplace and where space and accessibility are restrictive 1 1 1 3 Power supply options Powered from Phase A and external DC 1 1 1 4 All weather conditions Rugged shock resistant portable and weatherproof IP66 1 1 1 5 Safety Volt...

Page 9: ...o PQ45 4 voltage and 4 current channels 1 1 1 11 Expansion port This port allows for system expansion to include additional sensors input output controls and custom interfaces 1 1 1 12 Accessories ALL Powermonic PM35 and PM45 accessories can be used with the PQ35 and PQ45 models respectively 1 1 2 Connections and interfaces Photos in figures 1 1 2 1 1 1 2 2 1 1 2 3 and 1 1 2 4 show ports and hardw...

Page 10: ...uality com au Enquiries sales chkpowerquality com au Page 10 Address Unit 1 3 Tollis Place Seven Hills NSW 2147 Sydney Australia ABN 53 169 840 831 Telephone 61 2 8283 6945 Fax 61 2 8212 8105 Website www chkpowerquality com au Figure 1 1 2 1 Miro PQ35 Figure 1 1 2 2 Miro PQ45 Figure 1 1 2 3 Miro PQ35 A B C E D F A ...

Page 11: ...ity flexible current sensors 30 3600 A 600mm diameter 2 x temperature sensors free end magnetic mount 1 x set of voltage leads with banana ends with small clamps 1 x regulated DC adaptor 1 x single phase power cable 1 x carry bag 1 x CD Latest version of CITRUS application software and user manual Note that each unit is GPS enabled Each kit comprises of accessories with the colour code below PQ 25...

Page 12: ...AC10 CT 10A 15mm Iron PQ45 4 1AC100S CT 100A 15mm Iron 10 120A PQ45 4 1ASC500 CT 500A 52mm Iron 50 600A CAT IV 600V PQ45 4 1AF3000 6 CT 3000A Flexible 600mm 100 3600A Blue PQ45 4 1AF3000 6 H CT 3000A Flexible 600mm 30 3600A Blue PQ45 4 1AF3000 9 CT 3000A Flexible 900mm 100 3600A Blue PQ45 4 SAF3000 B CT 3000A Flexible 600mm 100 3600A Green PQ45 4 1 2 3 2 Voltage leads and attachments Part number D...

Page 13: ...PQ25 35 45 1 SA7002 A Temperature sensor free end PQ25 35 45 1 SA7002 M Temperature sensor magnetic mount PQ25 35 45 1 TBA USB communications lead for PQx5 PQ25 35 45 1 TBA DC probe 500A PQ25 35 45 4 TBA 3 2V 1 5Ah backup battery for PQx5 PQ25 35 45 1 TBA 3 2V 3 2Ah backup battery for PQx5 PQ25 35 45 1 1 3 Power options The MIRO can be powered in the following ways Voltage channel A o Single suppl...

Page 14: ... condition and fit for purpose 2 1 Periodic maintenance and testing The Miro and accessories should be inspected tested and tagged as per the normal procedures of your employer or responsible body 2 2 Equipment faults If the equipment is found to be faulty in any way including suspected blown fuses it should be returned to CHK Power Quality Pty Ltd for service 2 3 Calibration The Miro should be ca...

Page 15: ...able HRC fuses Refer to Section 10 6 on troubleshooting if you suspect a blown fuse If the Miro and accessories are used in a manner not specified in this manual the protection provided by the equipment may be impaired The Miro should not be immersed in water or other fluids The Miro should not be used in explosive atmospheres When any voltage clamp plug is connected to a hazardous live conductor ...

Page 16: ...hould be chosen so that the temperature limits are not exceeded External mountings should be such that there can be no access by the public 4 2 Hazard assessment Prior to using the Miro the operator must carry out a work site pre job hazard assessment to identify the safety and environmental needs This must be done prior to commencing work and prior to recommencing work after leaving and returning...

Page 17: ...figure 4 4 1 1 Step 2 Bring the strap forward to embrace the Miro as shown in figure 4 4 1 2 Step 3 Wrap the strap around the post and secure the Miro with the quick release clip at the rear as shown in figure 4 4 1 3 Figure 4 4 1 3 Figure 4 4 1 4 Do not connect the Miro to the pole without embracing the unit with the strap as this may weaken the holster over time refer to figure 4 4 1 4 4 4 2 Usi...

Page 18: ...ent probes are connected to the same phases as the voltage leads For example the A phase voltage must be measured by the A phase voltage clamp and the A phase current probe must measure the A phase current Current probe arrows should point to the load to ensure accurate power measurement Connect the current probes first making sure that They are connected to the appropriate phase and The arrow mar...

Page 19: ...hecking that LOG ON is shown on the bottom right hand corner of the LCD Wait indicates unit is waiting for configured start time Fin indicates that the configured stop time has already passed and unit will not log until reconfigured 4 7 Disconnecting the Miro When any voltage clamp plug is connected to a hazardous live conductor the other voltage clamp plugs should also be treated as live due to t...

Page 20: ...the Mirrin and Miro products 5 1 Installing the Citrus application software Step 1 Click on the following link which takes you to the Downloads page of the CHK Power Quality website http www chkpowerquality com au downloads Step 2 On the Downloads page click on Citrus Software as shown in figure 5 1 1 An executable file as highlighted by the file icon shown in figure 5 1 2 and appears at the botto...

Page 21: ...as shown in figure 5 1 6 Figure 5 1 5 Figure 5 1 6 The Citrus application is installed 5 2 Connecting to the Miro Step 1 Click on the Citrus icon shown in figure 5 2 1 in the start menu or double click on the Citrus icon on the desktop to launch the application The application form Citrus v0 913 shown in figure 5 2 2 will appear Note that the 0 913 is the software version number and will change ov...

Page 22: ...that the Connect USB button shown in figure 5 2 4 is now active The Miro will always power up with the CHK Power Quality branding as shown in figure 5 2 5 If the Miro is only powered from the USB cable then it will power up in USB Mode In this mode the graphical updates are disabled and the unit only displays USB MODE as shown in figure 5 2 6 Figure 5 2 5 Figure 5 2 6 If the Miro is in USB Mode an...

Page 23: ...es chkpowerquality com au Page 23 Address Unit 1 3 Tollis Place Seven Hills NSW 2147 Sydney Australia ABN 53 169 840 831 Telephone 61 2 8283 6945 Fax 61 2 8212 8105 Website www chkpowerquality com au The warning message only appears if the detected firmware is outdated There is no requirement to update the firmware Figure 5 2 7 Figure 5 2 8 ...

Page 24: ... managing the Miro are shown on the Miro Operations window Note that the Online Monitor button in figure 5 2 7 is inactive and that the Logging status is Off This is because the Miro is in USB Mode As shown in figure 5 2 9 the Online Monitor button is active and the Logging status is On when the Miro is out of USB Mode Figure 5 2 9 Note that if the Miro is not in USB mode and all power is removed ...

Page 25: ...Calibration state Normally the calibration state of the Miro is Good indicating that the Miro is fit for service If for some reason the Miro is not fit for service then the calibration state will change to Bad If Last calibrated exceeds 365 days then the calibration state will change to Due indicating that the Miro should be returned for calibration If Last calibrated exceeds 800 days then a messa...

Page 26: ...ne monitor The Online Monitor tool allows the user to view measurements in quasi real time without the need for logging Step 1 Click on the Online Monitor button on the Miro Operations window The Online Monitor form appears and provides menu tabs for the various monitoring screens as shown in figure 5 3 1 There are currently ten menu tabs and these include RMS and Power RMS Plot Harmonic Magnitude...

Page 27: ...stable Figure 5 3 1 1 5 3 2 Trigger event The user is able to trigger an event at any time manual trigger by clicking on the Trigger Event Captures button as shown in figure 5 3 2 1 The result is displayed and viewed in the Events section Figure 5 3 2 1 5 3 3 Sampling rate The sampling rate as shown in figure 5 3 3 1 is constantly updated and displayed at the top of the form It has a nominal value...

Page 28: ...eters are displayed and include i Frequency 10 sec ii True RMS values TRMS iii Crest factor CF iv Fundamental magnitude and phase v AC RMS vi DC value vii Real power Reactive power and apparent power viii True power factor TPF and displacement power factor DPF ix Negative and zero sequences values and x Underdeviation and overdeviation 5 3 6 Phasor diagram The Phasor Diagram screen shown in figure...

Page 29: ... 6945 Fax 61 2 8212 8105 Website www chkpowerquality com au Figure 5 3 6 2 The user has the option to combine the voltage and current phasors onto a single polar plot as shown in figure 5 3 6 3 by clicking the Combine button Figure 5 3 6 3 Click on the Split button to separate the plots The Reset button clears and redraws the graph to a default scale 5 3 7 RMS plot The RMS Plot screen shown in fig...

Page 30: ... 2 8283 6945 Fax 61 2 8212 8105 Website www chkpowerquality com au Figure 5 3 7 1 5 3 8 Harmonic magnitude table The Harmonic Magnitude table screen displays the rms value for each voltage and current harmonic up to and including the 50th harmonic as shown in figure 5 3 8 1 The total harmonic distortion THD is also calculated for each channel The user has the option to view values as RMS Magnitude...

Page 31: ...ne 61 2 8283 6945 Fax 61 2 8212 8105 Website www chkpowerquality com au Figure 5 3 8 1 5 3 9 Harmonic magnitude bar chart The Harmonic Magnitude bar chart screen displays the rms values of the harmonic spectrum for a range of harmonic numbers Figure 5 3 9 1 displays the spectrum for harmonic numbers in the range 1 50 which is the default range Figure 5 3 9 1 Selecting the 1 100 option button chang...

Page 32: ... 2 The user can zoom into a smaller range of interest by the application of a selection box Selection box Step 1 Move the mouse to the location where you wish to start Step 2 Click and hold down the mouse s left button Step 3 Drag the mouse to the final location enclosing the harmonics of interest and release the left button a shown in figure 5 3 9 3 The zoom resulting from the application of the ...

Page 33: ...lity com au Page 33 Address Unit 1 3 Tollis Place Seven Hills NSW 2147 Sydney Australia ABN 53 169 840 831 Telephone 61 2 8283 6945 Fax 61 2 8212 8105 Website www chkpowerquality com au Figure 5 3 9 3 Figure 5 3 9 4 Channel selection is effected by clicking on dropdown list box as shown in figure 5 3 9 5 and selecting either VA IA VB IB VC IC VGND or IN ...

Page 34: ...erquality com au Figure 5 3 9 5 5 3 10 Harmonic phase The Harmonic Phase screen displays the phase angle for each voltage and current harmonic up to and including the 50th harmonic as shown in figure 5 3 10 1 Figure 5 3 10 1 5 3 11 Harmonic power bar chart The Harmonic Power bar chart screen displays the live power or VA for each harmonic up to the 25th harmonic as shown in figure 5 3 11 1 No powe...

Page 35: ...t 1 3 Tollis Place Seven Hills NSW 2147 Sydney Australia ABN 53 169 840 831 Telephone 61 2 8283 6945 Fax 61 2 8212 8105 Website www chkpowerquality com au Figure 5 3 11 1 5 3 12 Interharmonics The Interharmonics screen displays the rms value for each voltage and current interhharmonic up to and including the 50th interharmonic as shown in figure 5 3 12 1 Figure 5 3 12 1 5 3 13 Flicker ...

Page 36: ...ace Seven Hills NSW 2147 Sydney Australia ABN 53 169 840 831 Telephone 61 2 8283 6945 Fax 61 2 8212 8105 Website www chkpowerquality com au The Flicker screen displays the values of the flicker indices for each voltage channel as shown in figure 5 3 13 1 Figure 5 3 13 1 5 3 14 Events The Events screen displays event information 5 3 14 1 No events The screen shown in figure 5 3 14 1 1 shows no even...

Page 37: ...s chkpowerquality com au Page 37 Address Unit 1 3 Tollis Place Seven Hills NSW 2147 Sydney Australia ABN 53 169 840 831 Telephone 61 2 8283 6945 Fax 61 2 8212 8105 Website www chkpowerquality com au Figure 5 3 14 1 1 5 3 14 2 Listed events Figure 5 3 14 2 1 shows a single event in the events list Figure 5 3 14 2 1 5 3 14 3 Event information ...

Page 38: ...owerquality com au The screen shown in figure 5 3 14 3 1 shows two events one RMS event and one waveform event Clicking the first event in the list will a highlight the selected event b automatically generate a chart with waveforms and c display details about the event above the chart Figure 5 3 14 3 1 5 3 14 4 Trace selection The user is able to remove or add any trace from the graph by clicking ...

Page 39: ...even Hills NSW 2147 Sydney Australia ABN 53 169 840 831 Telephone 61 2 8283 6945 Fax 61 2 8212 8105 Website www chkpowerquality com au 5 3 14 5 Zooming The user is able to zoom into the waveform by selecting a portion by the application of a selection box Selection box applied to figure 5 3 14 4 1 is shown in figure 5 3 14 5 1 with the result shown in figure 5 3 14 5 2 Figure 5 3 14 5 1 Figure 5 3...

Page 40: ...ss Unit 1 3 Tollis Place Seven Hills NSW 2147 Sydney Australia ABN 53 169 840 831 Telephone 61 2 8283 6945 Fax 61 2 8212 8105 Website www chkpowerquality com au 5 3 14 6 Examples of RMS and Mains Signalling events Further examples of RMS and Mains Signalling events are shown in figures 5 3 14 6 1 to 5 3 14 6 6 without and with zooming applied Figure 5 3 14 6 1 Figure 5 3 14 6 2 ...

Page 41: ...2016 Website www chkpowerquality com au Enquiries sales chkpowerquality com au Page 41 Address Unit 1 3 Tollis Place Seven Hills NSW 2147 Sydney Australia ABN 53 169 840 831 Telephone 61 2 8283 6945 Fax 61 2 8212 8105 Website www chkpowerquality com au Figure 5 3 14 6 3 Figure 5 3 14 6 4 ...

Page 42: ...t 1 3 Tollis Place Seven Hills NSW 2147 Sydney Australia ABN 53 169 840 831 Telephone 61 2 8283 6945 Fax 61 2 8212 8105 Website www chkpowerquality com au Figure 5 3 14 6 5 Figure 5 3 14 6 6 5 3 14 7 Examples of Coupled Mains Signalling RMS events Further examples of coupled Mains Signalling and RMS events are shown in figures 5 3 14 7 1 to 5 3 14 7 3 without and with zooming applied ...

Page 43: ...2016 Website www chkpowerquality com au Enquiries sales chkpowerquality com au Page 43 Address Unit 1 3 Tollis Place Seven Hills NSW 2147 Sydney Australia ABN 53 169 840 831 Telephone 61 2 8283 6945 Fax 61 2 8212 8105 Website www chkpowerquality com au Figure 5 3 14 7 1 Figure 5 3 14 7 2 ...

Page 44: ...SW 2147 Sydney Australia ABN 53 169 840 831 Telephone 61 2 8283 6945 Fax 61 2 8212 8105 Website www chkpowerquality com au Figure 5 3 14 7 3 5 3 14 8 Combining charts The user is able to combine the Volts and Amps view into a single chart by deselecting the Split Volts Amps check box and then again selecting the desired event Figure 5 3 14 81 1 shows the combined charts of that of figure 5 3 14 7 ...

Page 45: ...N 53 169 840 831 Telephone 61 2 8283 6945 Fax 61 2 8212 8105 Website www chkpowerquality com au 5 3 15 Waveforms The Waveforms screen displays the 10 12 waveforms of all voltage and current channels but is initially disabled as shown in figure 5 3 15 1 Update rate may be less often than every 10 12 cycles due to the volume of data transfer Figure 5 3 15 1 Select the Enable checkbox to view channel...

Page 46: ...ty com au Page 46 Address Unit 1 3 Tollis Place Seven Hills NSW 2147 Sydney Australia ABN 53 169 840 831 Telephone 61 2 8283 6945 Fax 61 2 8212 8105 Website www chkpowerquality com au The user is able to combine the Volts and Amps view into a single chart by deselecting the Split Volts Amps check box The new view is shown in figure 5 3 15 3 Figure 5 3 15 3 ...

Page 47: ...es chkpowerquality com au Page 47 Address Unit 1 3 Tollis Place Seven Hills NSW 2147 Sydney Australia ABN 53 169 840 831 Telephone 61 2 8283 6945 Fax 61 2 8212 8105 Website www chkpowerquality com au 5 4 Configuration Clicking on the Configuration button in figure 5 4 1 opens the Miro configuration window shown in figure 5 4 2 Figure 5 4 1 ...

Page 48: ...e 5 4 1 1 and located below the tabs Figure 5 4 1 1 5 4 1 1 Configuration description An option is provided to enter a description of the configuration In this case the configuration is blank 5 4 1 2 Reset to default Clicking the Reset To Default button sets the configuration to factory settings 5 4 1 3 Enable and disable log points Clicking the Enable All Log Points button ensures all parameters ...

Page 49: ... and d Days to 1GB 5 4 1 6 Load from and save to file The Load From File button allows a predefined configuration to be loaded The Save To File button allows the current configuration to be saved to a filename 5 4 1 7 Save configuration to device The Save Config To Device button loads the configuration to the Miro Configuration will be loaded and active immediately There is no need to stop logging...

Page 50: ...Figure 5 4 2 3 1 Figure 5 4 2 5 1 5 4 2 4 Channels The voltage VA VB VC and VGND and current IA IB IC and IN channels can be selected individually The two temperature channels T1 and T2 are grouped together and selected when the Temperature checkbox is ticked Note that for event capture purposes all channels are always captured These settings only affect log parameters such as RMS magnitude PQ45 o...

Page 51: ...0 seconds The user is able to click in the cell and alter the value or click on the arrow to expand the drop down box as shown in figure 5 4 3 2 which provides suggested values Figure 5 4 3 2 The default adjustable log interval is set to 60 seconds If the 10 12 cycle log interval is selected 1 The 10 12 cycle 200ms text is highlighted with a red background as shown in figure 5 4 3 3 2 A message bo...

Page 52: ...site www chkpowerquality com au Figure 5 4 3 3 Figure 5 4 3 4 If the 10 12 cycle log interval is selected a warning message appears on the Miro Operations window as shown in figure 5 4 3 5 alerting the user that this selection will consume memory As shown in figure 5 4 3 6 the message disappears when the 10 12 cycle log interval is deselected Figure 5 4 3 5 Figure 5 4 3 6 5 4 4 RMS and Power The R...

Page 53: ...he user 5 4 5 Harmonics Flicker The Harmonics Flicker tab shown in figure 5 4 5 1 provides options to select groups of harmonic magnitudes phases and interharmonics Groups include Harmonic Magnitudes 1 25 Harmonic Magnitudes 26 50 Harmonic Magnitudes 51 100 Harmonic Phase 1 25 Harmonic Phase 26 50 Interharmonic Magnitudes 0 24 Interharmonic Magnitudes 25 49 Interharmonic Magnitudes 50 99 and THD F...

Page 54: ...but also captures total RMS 5 4 7 IEC events The Dip Swell Interruption and RVC are all grouped as IEC Events as shown in figure 5 4 7 1 The detection Threshold and Hysteresis are user settable The magnitude in volts is based on the nominal voltage Figure 5 4 7 1 5 4 8 Capture triggers The Capture Triggers tab shown in figure 5 4 8 1 shows two trigger types the Sliding Reference Trigger and Transi...

Page 55: ...pes The Capture Types tab shown in figure 5 4 9 1 shows two capture types the waveform and RMS The triggers for the captures consist of IEC Events plus those set under Capture Triggers With the Waveform Capture the user has the option to select either a Short Capture or a Long Capture The Long Capture is particularly useful for capturing motor start waveforms Longer capture durations are available...

Page 56: ...nel If no current sensor is connected or an unapproved current sensor is connected to the Miro the display will show NONE indicating that the Miro has not recognised the sensor 5 4 10 4 Temperature The Temperature page displays temperature readings for the two temperature channels 5 4 10 5 Power The Power page displays the real power kW the apparent power kVA and the reactive power kvar for each p...

Page 57: ...xt that is entered in the text box shown in figure 5 4 10 1 5 4 10 12 Comms status The Comms Status page displays the cellular communication platform information on the screen else the page displays Comms Disabled if no communications platform is enabled The communication platform information includes State of the device e g Active QMI IP address e g 10 67 48 198 DNS e g Yes Type e g 4G Signal str...

Page 58: ...strument will retain its GPS date time 5 4 10 14 Common page information Each page is numbered and displays the date time and log status Log ON or Log OFF at the bottom of each page on a single line as shown in figure 5 4 10 14 1 Figure 5 4 10 14 1 The user can pre set future date times for the Log start and Log stop for a delayed log start In this case the log status will display Log WAIT until t...

Page 59: ...uency bands are summarised in the table below Mobile Network 2G calls and text 3G calls text and broadband 4G LTE fast broadband Telstra 900MHz 850MHz B5 2100MHz B1 700MHz B28 900MHz B8 1800MHz B3 2100MHz B1 2600MHz B7 Optus Virgin mobile 900MHz 900MHz B8 2100MHz B1 700MHz B28 1800MHz B3 2100MHz B1 2300MHz B40 2600MHz B7 Vodafone 900MHz 850MHz B5 900MHz B8 2100MHz B1 850MHz B5 1800MHz B3 Note 1 LT...

Page 60: ...vider Spark NZ network Cellular platforms HSPA 3G requires 850MHz and 2100MHz LTE 4G requires band 3 1800MHz and band 28 700MHz 5 5 Downloading and clearing memory Downloading can be done at any time and will not interrupt logging 5 5 1 Downloading data Step 1 The user can download logged data by clicking the Download button shown in figure 5 5 1 1 and ensuring that the Clear memory after download...

Page 61: ...ephone 61 2 8283 6945 Fax 61 2 8212 8105 Website www chkpowerquality com au Figure 5 5 1 3 Figure 5 5 1 4 Step 3 Once completed a message box appears as shown in figure 5 5 1 4 alerting the user that the file has been downloaded and provides an option for the user to open the file Click as desired Step 4 As shown in figure 5 5 1 5 the Clear Download Portion button on the Miro Operations window is ...

Page 62: ... 61 2 8283 6945 Fax 61 2 8212 8105 Website www chkpowerquality com au Figure 5 5 1 5 Figure 5 5 1 6 Step 5 Click the Clear Download Portion button on the Miro Operations window A message window displaying Data cleared appears as shown in figure 5 5 1 6 Click the OK button and the message box disappears The Miro Operations window now appears as shown in figure 5 5 1 7 with the progress bar still fu...

Page 63: ...tton shown in figure 5 5 2 1 and ensuring that the Clear memory after download checkbox is checked A window shown in figure 5 5 2 2 appears allowing the user to save the downloaded file with a predefined file name to a folder Step 2 Modify the file name as desired and click the Save button Figure 5 5 2 3 shows the progress of the file being downloaded Step 3 Once completed a message box appears as...

Page 64: ... www chkpowerquality com au Enquiries sales chkpowerquality com au Page 64 Address Unit 1 3 Tollis Place Seven Hills NSW 2147 Sydney Australia ABN 53 169 840 831 Telephone 61 2 8283 6945 Fax 61 2 8212 8105 Website www chkpowerquality com au Figure 5 5 2 1 Figure 5 5 2 2 Figure 5 5 2 3 Figure 5 5 2 4 ...

Page 65: ...user with the option to clear only that portion of data that was actually downloaded and preserves the data that the instrument was logging whilst downloading This allows for numerous sequential downloads with no gaps in the data If the Clear Download Portion button is clicked then a message box appears as shown in figure 5 5 6 confirming that data is cleared If the Clear All Memory button is clic...

Page 66: ...me Clicking on the Set Time button will set the RTC in the Miro to the PC time 5 8 Firmware update Step 1 Click on the Upgrade Firmware button shown in figure 5 8 1 A window opens as shown in figure 5 8 2 allowing the user to browse folders to select an updated firmware file Step 2 Select the desired file The updated file will automatically load into the Miro Figure 5 8 1 Figure 5 8 2 5 9 Miro dat...

Page 67: ...powerquality com au Figure 5 9 1 Figure 5 9 2 Select the desired Miro file The selected file is opened with information displayed in the Miro Data View window or viewer as shown in figure 5 9 3 The Viewer incorporates menus and graphical features that allow the user to analyse the downloaded data file Figure 5 9 3 The default information displayed upon selecting a file is the TRMS voltage and curr...

Page 68: ...6945 Fax 61 2 8212 8105 Website www chkpowerquality com au Figure 5 9 4 5 9 1 File 5 9 1 1 Open The user is able to open a file in a new viewer window by two methods Method 1 Step 1 Click the File menu shown in figure 5 9 1 1 1 A drop down box appears as shown in figure 5 9 1 1 2 Figure 5 9 1 1 1 Figure 5 9 1 1 2 Step 2 Hover and click on Open The user is prompted to select the same file or anothe...

Page 69: ...ated in any folder which then opens the file viewer window The user is able to open multiple windows from the same or different data files The file viewer automatically graphs the file data to display Volts Amps as shown in figure 5 9 3 5 9 1 2 Add file The user is able to add a file to an existing viewer window Step 1 Click the File menu shown in figure 5 9 1 2 1 A drop down box appears as shown ...

Page 70: ...h between the data traces from the two files Figure 5 9 1 2 4 In the above case the description identifier for the original data is sales demo and Power test for the additional data As shown in figure 5 9 3 no description identifier is appended to the legend when only one file is open Multiple files can be added 5 9 1 3 Remove file The user is able to remove a file to an existing viewer window if ...

Page 71: ...bsite www chkpowerquality com au Figure 5 9 1 3 1 Figure 5 9 1 3 2 Step 2 Hover and click on Remove File A window appears listing all open files as shown in figure 5 9 1 3 3 Figure 5 9 1 3 3 Step 3 Select the file you wish to remove and click on the OK button 5 9 1 4 Exit The user is able to close the file viewer by two methods Method 1 Step 1 Click the File menu shown in figure 5 9 1 4 1 A drop d...

Page 72: ...8212 8105 Website www chkpowerquality com au Method 2 Step 1 Click the X button located above the company logo as shown in figure 5 9 1 4 3 Figure 5 9 1 4 3 5 9 2 View 5 9 2 1 Save view to log file You wish to save the view shown in figure 5 9 2 1 1 Figure 5 9 2 1 1 Step 1 Click the View menu shown in figure 5 9 2 1 2 A drop down box appears as shown in figure 5 9 2 1 3 Step 2 Hover and click on S...

Page 73: ...e 61 2 8283 6945 Fax 61 2 8212 8105 Website www chkpowerquality com au Figure 5 9 2 1 2 Figure 5 9 2 1 3 Figure 5 9 2 1 4 5 9 2 2 Load saved view You wish to retrieve the view shown in figure 5 9 2 1 1 Step 1 Click the View menu shown in figure 5 9 2 2 1 A drop down box appears as shown in figure 5 9 2 2 2 Step 2 Hover and click on Load saved view A list box appears as shown in figure 5 9 2 2 3 al...

Page 74: ...kpowerquality com au Page 74 Address Unit 1 3 Tollis Place Seven Hills NSW 2147 Sydney Australia ABN 53 169 840 831 Telephone 61 2 8283 6945 Fax 61 2 8212 8105 Website www chkpowerquality com au Step 3 Select the desired view file and click OK The view will be loaded as shown in figure 5 9 2 2 4 Figure 5 9 2 2 3 Figure 5 9 2 2 4 5 9 2 3 Set zoom ...

Page 75: ...e www chkpowerquality com au The set zoom feature allows the user to set the minimum and maximum values for both the voltage and current scales Assuming the user wishes to change the scales for the graphs shown in figure 5 9 2 3 1 Figure 5 9 2 3 1 Step 1 Click the View menu shown in figure 5 9 2 3 1 A drop down box appears as shown in figure 5 9 2 3 2 Step 2 Hover and click on Set Zoom A list box ...

Page 76: ...as shown in figure 5 9 2 3 4 The predefined level in the input box is the value that the minimum is currently set to The user can alter this level Figure 5 9 2 3 3 Step 4 In this case set the level to 240 and click OK An input box apears as shown in figure 5 9 2 3 5 The predefined level in the input box is the value that the maximum is currently set to The user can alter this level Figure 5 9 2 3 ...

Page 77: ...3 169 840 831 Telephone 61 2 8283 6945 Fax 61 2 8212 8105 Website www chkpowerquality com au Figure 5 9 2 3 6 5 9 2 4 Cursors The user is able to insert cursors for voltage and current graphs Step 1 Click the View menu shown in figure 5 9 2 4 1 A drop down box appears as shown in figure 5 9 2 4 2 Step 2 Hover and click on Cursors A submenu apears listing the various available cursors as shown in f...

Page 78: ...n in figure 5 9 2 4 4 An input box appears as shown in figure 5 9 2 4 5 showing a default nominal voltage value which the user is able to change Step 2 Enter the desired value and click OK In this example the value is set to 230V An input box appears as shown in figure 5 9 2 4 6 showing a default percentage value which the user is able to change Enter the desired value and click OK In this example...

Page 79: ...quality com au Figure 5 9 2 4 7 Set Voltage Cursor Positions Step 1 Click the Set Voltage Cursor Positions button as shown in figure 5 9 2 4 8 An input box appears as shown in figure 5 9 2 4 9 showing a default upper limit voltage value which the user is able to change The input box also shows a default upper limit in this case 253 000 which is set to the configured IEC Swell threshold Refer to th...

Page 80: ... in figure 5 9 2 4 11 showing a default lower limit voltage value which the user is able to change The input box also shows a default lower limit in this case 207 000 which is set to the configured IEC Swell threshold Refer to the message box shown in figure 5 9 2 4 10 which appears when the question mark box is clicked The upper and lower limit voltage cursors are now displayed in figure 5 9 2 4 ...

Page 81: ...et current cursor positions Step 1 Click the Set Current Cursor Positions button as shown in figure 5 9 2 4 14 An input box appears as shown in figure 5 9 2 4 15 showing a default value of 359 929 which is set to the value in the middle of the graph Figure 5 9 2 4 14 Figure 5 9 2 4 15 Step 2 Enter the desired value and click the Ok button An input box appears as shown in figure 5 9 2 4 16 showing ...

Page 82: ... Place Seven Hills NSW 2147 Sydney Australia ABN 53 169 840 831 Telephone 61 2 8283 6945 Fax 61 2 8212 8105 Website www chkpowerquality com au Figure 5 9 2 4 16 Figure 5 9 2 4 17 Change current cursor position Click and drag the cursor up or down to change its position Toggle current cursors Step 1 Click the Toggle Current Cursors button as shown in figure 5 9 2 4 18 The current cursors disappear ...

Page 83: ...Toggle Current Cursors button again The current cursors reappear Toggle cursors for other axis Step 1 Click the Toggle Cursors For Other Axis button as shown in figure 5 9 2 4 19 A message box as shown in figure 5 9 2 4 20 appears if no mother axis available Figure 5 9 2 4 19 Figure 5 9 2 4 20 Figure 5 9 2 4 21 includes a frequency plot with its own set of cursors Step 2 Click the Toggle Cursors F...

Page 84: ... Sydney Australia ABN 53 169 840 831 Telephone 61 2 8283 6945 Fax 61 2 8212 8105 Website www chkpowerquality com au Figure 5 9 2 4 21 Toggle vertical cursors Step 1 Click the Toggle Vertical Cursors button as shown in figure 5 9 2 4 22 The vertical cursors disappear Figure 5 9 2 4 22 Step 2 Click the Toggle Vertical Cursors button again The cursors reappear 5 9 2 5 Add title The user is able to in...

Page 85: ...e 5 9 2 3 1 A drop down box appears as shown in figure 5 9 2 3 2 Figure 5 9 2 3 1 Figure 5 9 2 3 2 Step 2 Hover and click on Add Title A message input box apears as shown in figure 5 9 2 3 3 asking to type in a title Figure 5 9 2 3 3 Figure 5 9 2 3 4 Step 3 Type in a title and click OK In this case the title entered is Volts and Amps as shown in figure 5 9 2 3 4 The graph in figure 5 8 2 3 5 is no...

Page 86: ...y com au Figure 5 9 2 3 5 5 9 2 6 Add notes as footer This feature assumes that notes have been added and that the text for the notes is Profile of a Distribution Transformer Refer to section on Notes Step 1 Click the View menu shown in figure 5 9 2 6 1 A drop down box appears as shown in figure 5 9 2 6 2 Step 2 Hover and click on Add Notes as Footer The text is now appended to the graph as shown ...

Page 87: ... 831 Telephone 61 2 8283 6945 Fax 61 2 8212 8105 Website www chkpowerquality com au Figure 5 9 2 6 3 5 9 2 7 Add text annotation The user is able to insert text onto the graph Step 1 Click the View menu shown in figure 5 9 2 7 1 A drop down box appears as shown in figure 5 9 2 7 2 Figure 5 9 2 7 1 Figure 5 9 2 7 2 Step 2 Hover and click on Add Text Annotation A message input box apears as shown in...

Page 88: ...erquality com au Figure 5 9 2 7 3 Figure 5 9 2 7 4 Step 3 For example select VOLTS click OK as shown in figure 5 9 2 7 4 The input box as shown in figure 5 9 2 7 5 appears Step 4 Type in the desired comment as shown in figure 5 9 2 7 6 and click OK Figure 5 9 2 7 5 Figure 5 9 2 7 6 The comment will now appear in a text box as shown in figure 5 9 2 7 7 The text can be moved anywhere on the voltage ...

Page 89: ...e 61 2 8283 6945 Fax 61 2 8212 8105 Website www chkpowerquality com au Figure 5 9 2 7 7 Hiding the text annotation Hovering the mouse pointer in the text box and then holding down the left hand side button on the mouse drag the box away from the graph area and release the mouse button 5 9 2 8 Add arrow annotation The user is able to insert an arrow onto the graph Step 1 Click the View menu shown i...

Page 90: ...in figure 5 9 2 8 3 asking the user to select VOLTS or AMPS Figure 5 9 2 8 3 Figure 5 9 2 8 4 Step 3 For example select VOLTS click OK as shown in figure 5 9 2 8 4 The input box as shown in figure 5 9 2 8 5 appears Step 4 Type in the desired arrow length as shown in figure 5 9 2 8 6 and click OK Figure 5 9 2 8 5 Figure 5 9 2 8 6 The arrow will now appear on the voltage graph as shown in figure 5 9...

Page 91: ...2 8212 8105 Website www chkpowerquality com au The whole arrow can be moved by hovering the mouse pointer anywhere onto the arrow left clicking and holding down the left hand side button on the mouse and dragging the arrow anywhere on the graph This is shown in figure 5 9 2 8 8 Hiding the arrow annotation Hovering the mouse pointer onto the arrow and then holding down the left hand side button on ...

Page 92: ...ddress Unit 1 3 Tollis Place Seven Hills NSW 2147 Sydney Australia ABN 53 169 840 831 Telephone 61 2 8283 6945 Fax 61 2 8212 8105 Website www chkpowerquality com au Figure 5 9 2 8 8 5 9 2 9 Toggle split combine The file viewer automatically graphs the file data to display Volts Amps as two separate graphs one for voltage and the other for current as shown in figure 5 9 2 1 1 ...

Page 93: ...rquality com au Figure 5 9 2 1 1 The user is able to display the voltage and current onto a single graph Step 1 Click the View menu shown in figure 5 9 2 1 2 A drop down box appears as shown in figure 5 9 2 1 3 Figure 5 9 2 1 2 Figure 5 9 2 1 3 Step 2 Hover and click on Toggle Split Combine The screen view automatically alters the graphs as shown in figure 5 9 2 1 4 Note that the axis for the curr...

Page 94: ... Seven Hills NSW 2147 Sydney Australia ABN 53 169 840 831 Telephone 61 2 8283 6945 Fax 61 2 8212 8105 Website www chkpowerquality com au Figure 5 9 2 1 4 The combining and splitting of the charts is applicable to any set of graphed parameters and not limited only to the Volts Amp display For example figures 5 9 2 1 5 and 5 9 2 1 6 show TRMS and frequency magnitudes graphed as split and combined gr...

Page 95: ...15 August 2016 Website www chkpowerquality com au Enquiries sales chkpowerquality com au Page 95 Address Unit 1 3 Tollis Place Seven Hills NSW 2147 Sydney Australia ABN 53 169 840 831 Telephone 61 2 8283 6945 Fax 61 2 8212 8105 Website www chkpowerquality com au Figure 5 9 2 1 5 ...

Page 96: ...2 8283 6945 Fax 61 2 8212 8105 Website www chkpowerquality com au Figure 5 9 2 1 6 5 9 2 10 Toggle date time mode Step 1 Click the View menu shown in figure 5 9 2 2 1 A drop down box appears as shown in figure 5 9 2 2 2 Step 2 Hover and click on Toggle Date Time mode The screen view automatically alters the time scale on the time axis as shown in figures 5 9 2 2 3 and 5 9 2 2 4 The time mode can b...

Page 97: ...15 August 2016 Website www chkpowerquality com au Enquiries sales chkpowerquality com au Page 97 Address Unit 1 3 Tollis Place Seven Hills NSW 2147 Sydney Australia ABN 53 169 840 831 Telephone 61 2 8283 6945 Fax 61 2 8212 8105 Website www chkpowerquality com au Figure 5 9 2 2 3 ...

Page 98: ...phone 61 2 8283 6945 Fax 61 2 8212 8105 Website www chkpowerquality com au Figure 5 9 2 2 4 5 9 2 11 Close tabs The user is able to remove tabs using the Close Tab button Step 1 Click the View menu shown in figure 5 9 2 11 1 A drop down box appears as shown in figure 5 9 2 11 2 Figure 5 9 2 11 1 Figure 5 9 2 11 2 Note that the Close Tab button is disabled It is only enabled when two or more tabs a...

Page 99: ... NSW 2147 Sydney Australia ABN 53 169 840 831 Telephone 61 2 8283 6945 Fax 61 2 8212 8105 Website www chkpowerquality com au Figure 5 9 2 11 3 Step 2 Click the View menu shown in figure 5 9 2 11 1 again A drop down box appears as shown in figure 5 9 2 11 4 Note that the Close Tab button is now active Figure 5 9 2 11 4 Step 3 Click on the Close Tab button The active tab is now removed as shown in f...

Page 100: ...ia ABN 53 169 840 831 Telephone 61 2 8283 6945 Fax 61 2 8212 8105 Website www chkpowerquality com au Figure 5 9 2 11 5 5 9 3 Export 5 9 3 1 Print The user is able to print the graphs using the Print function Step 1 Click the Print button shown in figure 5 9 3 1 1 The printer setup form appears as shown in figure 5 9 3 1 2 Figure 5 9 3 1 1 Figure 5 9 3 1 2 Step 2 Select the desired printer and pref...

Page 101: ...105 Website www chkpowerquality com au 5 9 3 2 Generate PDF The user is able to convert the graph in to a PDF Step 1 Click the Export menu shown in figure 5 9 3 2 1 A drop down box appears as shown in figure 5 9 3 2 2 Figure 5 9 3 2 1 Figure 5 9 3 2 2 Step 2 Hover and click on Generate PDF A window opens as shown in figure 5 9 3 2 3 allowing the user to enter a file name and save to a particlar fo...

Page 102: ... PNG The user is able to convert the graph in to a PNG Follow the steps outlined in section 5 9 3 2 but select the Generate PNG button rather than the Generate PDF button 5 9 3 4 Generate SVG The user is able to convert the graph in to a SVG Follow the steps outlined in section 5 9 3 2 but select the Generate SVG button rather than the Generate PDF button 5 9 3 5 Copy to clipboard The user is able...

Page 103: ...ty com au Step 2 Hover and click on Copy to Clipboard 5 9 3 6 Generate CSV The user is able to save the viewed data to a CSV file Step 1 Click the Export menu shown in figure 5 9 3 6 1 A drop down box appears as shown in figure 5 9 3 6 2 Figure 5 9 3 6 1 Figure 5 9 3 6 2 Step 2 Hover and click on Generate CSV A window opens as shown in figure 5 9 3 6 3 allowing the user to enter a file name and sa...

Page 104: ...tralia ABN 53 169 840 831 Telephone 61 2 8283 6945 Fax 61 2 8212 8105 Website www chkpowerquality com au Figure 5 8 3 6 4 5 9 3 7 Generate table The user is able to generate a table of the viewed data Step 1 Click the Export menu shown in figure 5 9 3 7 1 A drop down box appears as shown in figure 5 9 3 7 2 Figure 5 9 3 7 1 Figure 5 9 3 7 2 Step 2 Hover and click on Generate Table A Data Table for...

Page 105: ... 8212 8105 Website www chkpowerquality com au Figure 5 9 3 7 3 5 9 4 Measurements There are five measurement groups as shown in figure 5 9 4 1 and include RMS and Frequency Power and Unbalance Harmonics Flicker and Temperature Figure 5 9 4 1 5 9 4 1 RMS and frequency Clicking on RMS and Frequency in the Measurements menu generates a sub menu listing TRMS DC AC Crest Factor Fundamental Magnitude Fu...

Page 106: ...ustralia ABN 53 169 840 831 Telephone 61 2 8283 6945 Fax 61 2 8212 8105 Website www chkpowerquality com au Figure 5 9 4 1 1 Clicking on TRMS generates graphs displaying voltage and current for selected channels as shown in figure 5 9 4 1 2 Figure 5 9 4 1 2 Clicking on AC or DC generates graphs displaying only AC or DC components of the voltage and current for selected channels as shown in figures ...

Page 107: ... 2016 Website www chkpowerquality com au Enquiries sales chkpowerquality com au Page 107 Address Unit 1 3 Tollis Place Seven Hills NSW 2147 Sydney Australia ABN 53 169 840 831 Telephone 61 2 8283 6945 Fax 61 2 8212 8105 Website www chkpowerquality com au Figure 5 9 4 1 3 Figure 5 9 4 1 4 ...

Page 108: ...en Hills NSW 2147 Sydney Australia ABN 53 169 840 831 Telephone 61 2 8283 6945 Fax 61 2 8212 8105 Website www chkpowerquality com au Clicking on Crest Factor generates a graph displaying the crest factor for selected channels as shown in figure 5 9 4 1 5 Figure 5 9 4 1 5 Clicking on Fundamental Magnitude generates graphs displaying the fundamental magnitude for selected channels as shown in figure...

Page 109: ...uality com au Page 109 Address Unit 1 3 Tollis Place Seven Hills NSW 2147 Sydney Australia ABN 53 169 840 831 Telephone 61 2 8283 6945 Fax 61 2 8212 8105 Website www chkpowerquality com au Figure 5 9 4 1 6 Clicking on Fundamental Phase generates a graph displaying the fundamental phase for selected channels as shown in figure 5 9 4 1 7 Figure 5 9 4 1 7 ...

Page 110: ...stralia ABN 53 169 840 831 Telephone 61 2 8283 6945 Fax 61 2 8212 8105 Website www chkpowerquality com au Clicking on Frequency generates a graph displaying the frequency for only VA as shown in figure 5 9 4 1 8 Figure 5 9 4 1 8 Clicking on Underdeviation or Overdeviation generates graphs displaying the under deviation and over deviation measures for selected voltage channels and shown in figures ...

Page 111: ...2016 Website www chkpowerquality com au Enquiries sales chkpowerquality com au Page 111 Address Unit 1 3 Tollis Place Seven Hills NSW 2147 Sydney Australia ABN 53 169 840 831 Telephone 61 2 8283 6945 Fax 61 2 8212 8105 Website www chkpowerquality com au Figure 5 9 4 1 9 Figure 5 9 4 1 10 ...

Page 112: ...chkpowerquality com au 5 9 4 2 Power and unbalance Clicking on Power and Unbalance in the Measurements menu generates a sub menu listing Real Power Reactive Power Apparent Power True Power Factor Displacement Power Factor Real Power Total Reactive Power Total Apparent Power Total Unbalance Negative Sequence and Unbalance Zero Sequence measures as shown in figure 5 9 4 2 1 Figure 5 9 4 2 1 Clicking...

Page 113: ...s Place Seven Hills NSW 2147 Sydney Australia ABN 53 169 840 831 Telephone 61 2 8283 6945 Fax 61 2 8212 8105 Website www chkpowerquality com au Clicking on Reactive Power generates a graph displaying the reactive power for each phase as shown in figure 5 9 4 2 3 Figure 5 9 4 2 3 Clicking on Apparent Power generates a graph displaying the apparent power for each phase as shown in figure 5 9 4 2 4 ...

Page 114: ...erquality com au Page 114 Address Unit 1 3 Tollis Place Seven Hills NSW 2147 Sydney Australia ABN 53 169 840 831 Telephone 61 2 8283 6945 Fax 61 2 8212 8105 Website www chkpowerquality com au Figure 5 9 4 2 4 Clicking on True Power Factor generates a graph displaying the true power factor for each phase as shown in figure 5 9 4 2 5 Figure 5 9 4 2 5 ...

Page 115: ...ce Seven Hills NSW 2147 Sydney Australia ABN 53 169 840 831 Telephone 61 2 8283 6945 Fax 61 2 8212 8105 Website www chkpowerquality com au Clicking on Displacement Power Factor generates a graph displaying the displacement power factor for each phase as shown in figure 5 9 4 2 6 Figure 5 9 4 2 6 Clicking on Real Power Total generates a graph displaying the total real power as shown in figure 5 9 4...

Page 116: ...hkpowerquality com au Page 116 Address Unit 1 3 Tollis Place Seven Hills NSW 2147 Sydney Australia ABN 53 169 840 831 Telephone 61 2 8283 6945 Fax 61 2 8212 8105 Website www chkpowerquality com au Figure 5 9 4 2 7 Clicking on Reactive Power Total generates a graph displaying the total reactive power as shown in figure 5 9 4 2 8 Figure 5 9 4 2 8 ...

Page 117: ... Seven Hills NSW 2147 Sydney Australia ABN 53 169 840 831 Telephone 61 2 8283 6945 Fax 61 2 8212 8105 Website www chkpowerquality com au Clicking on Apparent Power Total generates a graph displaying the total apparent power as shown in figure 5 9 4 2 9 Figure 5 9 4 2 9 Clicking on Unbalance Negative Sequence generates a graph displaying Unbalance due to negative sequencing as shown in figure 5 9 4...

Page 118: ...quality com au Page 118 Address Unit 1 3 Tollis Place Seven Hills NSW 2147 Sydney Australia ABN 53 169 840 831 Telephone 61 2 8283 6945 Fax 61 2 8212 8105 Website www chkpowerquality com au Figure 5 9 4 2 10 Clicking on Unbalance Zero Sequence generates a graph displaying Unbalance due to zero sequencing as shown in figure 5 9 4 2 11 Figure 5 9 4 2 11 ...

Page 119: ...es a sub menu listing Harmonic Magnitude Harmonic Phase Interharmonic Magnitude and THD measures as shown in figure 5 9 4 3 1 Figure 5 9 4 3 1 Clicking on Harmonic Magnitude generates another form with checkboxes to select up to 100 harmonics as shown in figure 5 9 4 3 2 The form also provides option buttons to select harmonic groups as shown in figure 5 9 4 3 3 Figure 5 9 4 3 3 Figure 5 9 4 3 2 C...

Page 120: ...it 1 3 Tollis Place Seven Hills NSW 2147 Sydney Australia ABN 53 169 840 831 Telephone 61 2 8283 6945 Fax 61 2 8212 8105 Website www chkpowerquality com au Figure 5 9 4 3 4 Clicking on Interharmonic Magnitude generates another form with checkboxes to select up to 100 harmonics as shown in figure 5 9 4 3 5 Figure 5 9 4 3 5 Clicking on THD generates a graph as shown in figure 5 9 4 3 6 ...

Page 121: ...dney Australia ABN 53 169 840 831 Telephone 61 2 8283 6945 Fax 61 2 8212 8105 Website www chkpowerquality com au Figure 5 9 4 3 6 5 9 4 4 Flicker Clicking on Flicker in the Measurements menu generates a sub menu listing Short term Pst and Long term Plt flicker indices as shown in figure 5 9 4 4 1 Figure 5 9 4 4 1 Clicking on Short term Pst and Long term Plt yields graphs as shown in figures 5 9 4 ...

Page 122: ...quiries sales chkpowerquality com au Page 122 Address Unit 1 3 Tollis Place Seven Hills NSW 2147 Sydney Australia ABN 53 169 840 831 Telephone 61 2 8283 6945 Fax 61 2 8212 8105 Website www chkpowerquality com au Figure 5 9 4 4 2 The index is a dimensionless number and displayed on the right hand side of the graph Figure 5 9 4 4 3 ...

Page 123: ... 6945 Fax 61 2 8212 8105 Website www chkpowerquality com au The index is a dimensionless number and displayed on the right hand side of the graph 5 9 4 5 Temperature Clicking on Temperature in the Measurements menu generates a graph as shown in figure 5 9 4 5 1 Figure 5 9 4 5 1 The temperature values are in degrees Celsius and displayed on the right hand side of the graph If no temperature values ...

Page 124: ...8283 6945 Fax 61 2 8212 8105 Website www chkpowerquality com au 5 9 5 Events Clicking on Events opens the Event form as shown in figure 5 9 5 1 The list box on the left hand side is populated with all the events Clicking an event in the list box will a highlight the selected event b automatically generate a chart on Event Graph and c display details about the event above the chart as shown in figu...

Page 125: ...chkpowerquality com au Figure 5 9 5 2 5 9 5 1 Event filters Two event filters provided a Check box event type filters and b Sliding reference filter minimum deviation control slider Figure 5 9 5 1 1 Check box event type filter The checkbox type include Dip Swell Int RMS Capture RVC Waveform Capture Mains Signal Maximum and Mains Signal Capture The checkboxes allow the user to restrict the visibili...

Page 126: ... Website www chkpowerquality com au The sliding reference include Dip Swell Int RMS Capture RVC Waveform Capture Mains Signal Maximum and Mains Signal Capture The sliding reference minimum deviation control slider allows the user to filter out events below the minimum percent deviation from the reference value An example is shown in figure 5 9 5 1 3 where the slider is set to a sliding reference m...

Page 127: ...ress Unit 1 3 Tollis Place Seven Hills NSW 2147 Sydney Australia ABN 53 169 840 831 Telephone 61 2 8283 6945 Fax 61 2 8212 8105 Website www chkpowerquality com au Figure 5 9 5 1 3 Figure 5 9 5 1 4 5 9 5 2 Event selection via up down buttons The Up and Down buttons shown in figures 5 9 5 2 1 and 5 9 5 2 2 allow the next event selection to be above or below the current selection ...

Page 128: ... 1 3 Tollis Place Seven Hills NSW 2147 Sydney Australia ABN 53 169 840 831 Telephone 61 2 8283 6945 Fax 61 2 8212 8105 Website www chkpowerquality com au Figure 5 9 5 2 1 Figure 5 9 5 2 2 5 9 5 3 Combining charts The user is able to combine the Volts and Amps view into a single chart by deselecting the Split Volts Amps check box The new view is shown in figure 5 9 5 3 1 Figure 5 9 5 3 1 ...

Page 129: ...f deselected traces changes to a faint grey Figure 5 9 5 4 1 shows only phase A voltage and current traces Figure 5 9 5 4 1 5 9 5 5 Reload button The Reload button updates the graph to the default selected event graph without having to reselect the event This feature allows the user to quickly update the graph after visual configurational changes 5 9 5 6 Voltage as of nominal The voltage axis can ...

Page 130: ...uality com au Figure 5 9 5 6 1 Figure 5 9 5 6 2 5 9 5 7 Add title The user is able to insert a title on the event graph Step 1 Click the Add Title button shown in figure 5 9 5 7 1 Figure 5 9 5 7 1 A drop down box appears as shown in figure 5 9 5 7 2 Enter text As shown in figure 5 9 5 7 3 Mains signalling is entred in this example Figure 5 9 5 7 2 Figure 5 9 5 7 3 Step 2 Click on the OK button The...

Page 131: ...47 Sydney Australia ABN 53 169 840 831 Telephone 61 2 8283 6945 Fax 61 2 8212 8105 Website www chkpowerquality com au Figure 5 9 5 7 4 5 9 5 8 Add cursors The Add Cursors button generates a set of horizontal and vertical cursors on the graphs as shown in figure 5 9 5 8 1 Clicking the Reload button removes the cursors The user is able to continuously add a new set of cursors on the graph by clickin...

Page 132: ...chkpowerquality com au Figure 5 9 5 8 1 5 9 5 9 Clipboard The Clipboard button allows the user to save the event graph to the Clipboard Step 1 Click the Clipboard button shown in figure 5 9 5 7 1 The graph is now saved to the clipboard 5 9 5 10 Print The user is able to print the event graph using the Print function Step 1 Click the Print button shown in figure 5 9 5 7 1 The printer setup form app...

Page 133: ...212 8105 Website www chkpowerquality com au Figure 5 9 5 10 1 5 9 5 11 Export PDF The user is able to convert the graph in to a PDF Step 1 Click the Export PDF button shown in figure 5 9 5 7 1 A window opens as shown in figure 5 9 5 11 1 allowing the user to enter a file name and save to a particlar folder Enter a filename and click Save Figure 5 9 5 11 1 As shown in figure 5 9 5 11 2 the user can...

Page 134: ...2 8283 6945 Fax 61 2 8212 8105 Website www chkpowerquality com au Figure 5 9 5 11 2 Step 2 Click on the saved PDF The example PDF is shown in figure 5 9 5 11 3 Figure 5 9 5 11 3 5 9 5 12 Export table The Export Table button generates a table of values for the graphical view For example in figure 5 9 5 12 1 a Mains Signalling Capture event is highlighted and a graph generated The user can then clic...

Page 135: ...werquality com au Page 135 Address Unit 1 3 Tollis Place Seven Hills NSW 2147 Sydney Australia ABN 53 169 840 831 Telephone 61 2 8283 6945 Fax 61 2 8212 8105 Website www chkpowerquality com au If no event is selected and no view generated then no table will be generated if the user clicks the Export Table button Figure 5 9 5 12 1 Figure 5 9 5 12 2 ...

Page 136: ...n opens a submenu showing the current list of analyses that include Harmonic Average Harmonic Compliance Voltage Compliance Energy Daily Min Max and ITI CBEMA Curve as shown in figure 5 9 6 1 Figure 5 9 6 1 5 9 6 1 Harmonic average Clicking on the Harmonic Average button generates a sub menu as shown in figures 5 9 6 1 1 and 5 9 6 1 2 with options to select graphs with amplitudes as percentage of ...

Page 137: ...www chkpowerquality com au Enquiries sales chkpowerquality com au Page 137 Address Unit 1 3 Tollis Place Seven Hills NSW 2147 Sydney Australia ABN 53 169 840 831 Telephone 61 2 8283 6945 Fax 61 2 8212 8105 Website www chkpowerquality com au Figure 5 9 6 1 3 Figure 5 9 6 1 4 5 9 6 2 Harmonic compliance ...

Page 138: ... au Harmonic voltage Clicking on the Harmonic Compliance button generates a series of submenus as shown in figures 5 9 6 2 1 and 5 9 6 2 2 with options to select voltage graphs with amplitudes as percentage of fundamental or proportion of compliance limits Figure 5 9 6 2 1 Figure 5 9 6 2 2 Clicking the OK button in figure 5 9 6 2 2 generates the respective graphs shown in figures 5 9 6 2 3 and 5 9...

Page 139: ...elephone 61 2 8283 6945 Fax 61 2 8212 8105 Website www chkpowerquality com au Figure 5 9 6 2 4 Harmonic voltage limits Clicking on the Set Configuration Limits as shown in figure 5 9 6 2 5 opens a form as shown in figure 5 9 6 2 6 that allows the user to alter the limits for each harmonic Figure 5 9 6 2 5 Figure 5 9 6 2 6 Limits can also be loaded from two predefined standards that include AS61000...

Page 140: ...ct current graphs with amplitudes as percentage of maximum demand or proportion of compliance limits Figure 5 9 6 2 7 Figure 5 9 6 2 8 Clicking on the Percentage of Maximum Demand button or the Proportion of Compliance Limit button opens the input box shown in figure 5 9 6 2 9 prompting the user to enter a value for the maximum demand For this example the value of 500A is entered as shown in figur...

Page 141: ... www chkpowerquality com au Enquiries sales chkpowerquality com au Page 141 Address Unit 1 3 Tollis Place Seven Hills NSW 2147 Sydney Australia ABN 53 169 840 831 Telephone 61 2 8283 6945 Fax 61 2 8212 8105 Website www chkpowerquality com au Figure 5 9 6 2 11 Figure 5 9 6 2 12 Harmonic current limits ...

Page 142: ...ter the limits for each harmonic Figure 5 9 6 2 13 Figure 5 9 6 2 14 Limits can also be loaded from two predefined standards that include AS61000 2 2 and IEEE519 table 10 3 or from a saved file 5 9 6 3 Voltage compliance Clicking on the Voltage Compliance button opens another submenu providing options to select either Setup Percentile Table or Histogram as shown in figure 5 9 6 3 1 Figure 5 9 6 3 ...

Page 143: ...gions on the graph The percentiles are calculated for voltages that exceed the Threshold voltage and therefore useful in discarding from the analysis voltages below the threshold Clicking on the OK button automatically saves the profile with the current Profile Name The user is able to load a profile by clicking on the Load Previous button A list box appears allowing the user to select a profile T...

Page 144: ...831 Telephone 61 2 8283 6945 Fax 61 2 8212 8105 Website www chkpowerquality com au Figure 5 9 6 3 3 Figure 5 9 6 3 3 shows that all channel metrics are in compliance The corresponding histogram can be generated by clicking on Histogram button and is shown in figure 5 9 6 3 4 Figure 5 9 6 3 4 The user can restrict the voltage compliance analysis to any combination of VA VB and VC by selecting the d...

Page 145: ...s Place Seven Hills NSW 2147 Sydney Australia ABN 53 169 840 831 Telephone 61 2 8283 6945 Fax 61 2 8212 8105 Website www chkpowerquality com au Figure 5 9 6 3 5 For example as shown in figure 5 9 6 3 6 if only channel A is selected then the percentile table will only show VA and indicate the corresponding compliance status Figure 5 9 6 3 6 The corresponding histogram is shown in figure 5 9 6 3 7 ...

Page 146: ...Hills NSW 2147 Sydney Australia ABN 53 169 840 831 Telephone 61 2 8283 6945 Fax 61 2 8212 8105 Website www chkpowerquality com au Figure 5 9 6 3 7 The voltage compliance analysis normally discards flagged measurements which are only triggered by dips swells and interruptions The Setup form allows the user to Include Flagged Values Figures 5 9 6 3 8 and 5 9 6 3 9 shows histograms with and without f...

Page 147: ... 2016 Website www chkpowerquality com au Enquiries sales chkpowerquality com au Page 147 Address Unit 1 3 Tollis Place Seven Hills NSW 2147 Sydney Australia ABN 53 169 840 831 Telephone 61 2 8283 6945 Fax 61 2 8212 8105 Website www chkpowerquality com au Figure 5 9 6 3 8 Figure 5 9 6 3 9 ...

Page 148: ...ckbox The corresponding histogram is shown in figure 5 9 6 3 10 Figure 5 9 6 3 10 5 9 6 4 Energy Clicking on the Energy button opens another submenu providing options to select either kWh kvarh kVAh kWh hourly profile or kWh hourly import export as shown in figure 5 9 6 4 1 Click on the kWh button and a table appears as shown in figure 5 9 6 4 2 displaying the total energy in kWh for each phase an...

Page 149: ...ty com au Page 149 Address Unit 1 3 Tollis Place Seven Hills NSW 2147 Sydney Australia ABN 53 169 840 831 Telephone 61 2 8283 6945 Fax 61 2 8212 8105 Website www chkpowerquality com au Figure 5 9 6 4 3 Figure 5 9 6 4 4 Click on kWh hourly profile or kWh hourly import export buttons and graphs shown in figures 5 9 6 4 5 and 5 9 6 4 6 appear Figure 5 9 6 4 5 ...

Page 150: ...ality com au Figure 5 9 6 4 6 5 9 6 5 Daily min max Clicking on the Daily Min Max button opens a submenu providing options to select either TRMS Frequency THD True Power Factor KW Kvar kVA or Mains Signalling Maximum as shown in figure 5 9 6 5 1 Figure 5 9 6 5 1 Clicking any of the submenu buttons listed above generates a table which displays the daily minimum and maximum of the relevant metric fo...

Page 151: ... Australia ABN 53 169 840 831 Telephone 61 2 8283 6945 Fax 61 2 8212 8105 Website www chkpowerquality com au Figure 5 9 6 5 2 5 9 6 6 ITI CBEMA curve Clicking on the ITI CBEMA Curve button shown in figure 5 9 6 6 1 generates a graph as shown in figure 5 9 6 6 2 The graph plots dips and swells In this case nothing is plotted as no dips or swells are recorded Figure 5 9 6 6 3 shows a graph with dip ...

Page 152: ... 2016 Website www chkpowerquality com au Enquiries sales chkpowerquality com au Page 152 Address Unit 1 3 Tollis Place Seven Hills NSW 2147 Sydney Australia ABN 53 169 840 831 Telephone 61 2 8283 6945 Fax 61 2 8212 8105 Website www chkpowerquality com au Figure 5 9 6 6 2 Figure 5 9 6 6 3 ...

Page 153: ...ww chkpowerquality com au 5 9 7 View Configuration Clicking on the View Configuration menu button provides the user with the configuration attached to the data file as shown in figure 5 9 7 1 The user is unable to change the configuration from this view Figure 5 9 7 1 5 9 7 1 Multiple configurations If the user has more than one data file opened then when clicking on the View Configuration menu bu...

Page 154: ...ustralia ABN 53 169 840 831 Telephone 61 2 8283 6945 Fax 61 2 8212 8105 Website www chkpowerquality com au Figure 5 9 7 1 1 5 9 8 Device information Clicking on the Device Information menu button provides the user with Miro specific information as shown in figure 5 9 8 1 Figure 5 9 8 1 5 9 9 Notes Step 1 Click the Notes menu shown in figure 5 9 9 1 1 An input box appears as shown in figure 5 9 9 1...

Page 155: ...831 Telephone 61 2 8283 6945 Fax 61 2 8212 8105 Website www chkpowerquality com au Figure 5 9 9 1 1 Figure 5 9 9 1 2 Step 2 Type in desired text Figure 5 9 9 1 3 shows example text Click Save Figure 5 9 9 1 3 Figure 5 9 9 1 4 Step 3 Click the View menu as shown in figure 5 9 9 1 4 and then on Add Notes as Footer The text is now appended to the graph as shown in figure 5 9 9 1 5 Clicking the Add No...

Page 156: ...945 Fax 61 2 8212 8105 Website www chkpowerquality com au Figure 5 9 9 1 5 5 9 10 Tools 5 9 10 1 Merge open files Note This feature requires that at least two files are added to the active window Step 1 Click the Tools menu shown in figure 5 9 10 1 1 A drop down box appears as shown in figure 5 9 10 1 2 Figure 5 9 10 1 1 Figure 5 9 10 1 2 Step 2 Hover and click on Merge Open Files A window apears ...

Page 157: ...stralia ABN 53 169 840 831 Telephone 61 2 8283 6945 Fax 61 2 8212 8105 Website www chkpowerquality com au Figure 5 9 10 1 3 A message box appears as shown in figure 5 9 10 1 4 confirming the file merge Figure 5 9 10 1 4 5 9 10 2 Split file Note This feature requires that at date range be set Step 1 Click the Tools menu shown in figure 5 9 10 2 1 A drop down box appears as shown in figure 5 9 10 2 ...

Page 158: ...ia ABN 53 169 840 831 Telephone 61 2 8283 6945 Fax 61 2 8212 8105 Website www chkpowerquality com au Step 2 Hover and click on Split File A window apears as shown in figure 5 9 10 2 3 allowing the user to save the split file Click on Save A message box appears as shown in figure 5 9 10 2 4 confirming the file split Figure 5 9 10 2 3 Figure 5 9 10 2 4 If a date range is not selected then a message ...

Page 159: ...ity com au Figure 5 9 10 2 5 5 9 11 Options 5 9 11 1 Time zones Miro data is logged in UTC time The user is able to select a time zone for displaying data Step 1 Click the Options menu shown in figure 5 9 11 1 1 A drop down box appears as shown in figure 5 9 11 1 2 Figure 5 9 11 1 1 Figure 5 9 11 1 2 Step 2 Hover and click on Display Time Zone A form showing a list of time zones appears as shown i...

Page 160: ... chkpowerquality com au Figure 5 9 11 1 3 Step 3 Click the OK button If no time zone has been selected then a message box appears as shown in figure 5 9 11 1 4 The updated time zone appears just under the Citrus software version number as shown in figure 5 9 11 1 5 Figure 5 9 11 1 4 Figure 5 9 11 1 5 5 9 11 2 Colour settings The user is able to alter the colour settings Step 1 Click the Options me...

Page 161: ...one 61 2 8283 6945 Fax 61 2 8212 8105 Website www chkpowerquality com au Step 2 Hover and click on Colour Settings A form showing the colour settings appears as shown in figure 5 9 11 2 3 The user can change the settings by moving the scroll bars or click on the Default Colours button for factory settings Figure 5 9 11 2 3 5 9 12 Help Clicking on the Help menu button provides the user with informa...

Page 162: ...play data at any of the six log intervals provided it has been logged at the desired log intervals if not then the log interval will be disabled The example below in figure 5 9 13 1 1 shows that 10 12 150 180 as disabled Figure 5 9 13 1 1 5 9 13 2 Channel filter The user can view any combination of voltage and current channels as shown in figure 5 9 13 2 1 Figure 5 9 13 2 1 The user can quickly di...

Page 163: ...rt and finish dates and times are displayed to the right of the date filter The data range is also displayed In this case it is 22 hours 22 minutes and 35 seconds Figure 5 9 13 4 1 The date filter can be changed in various ways and include 1 Directly 2 Cursors 3 Zoom 4 Power up down and 5 Reset If the start and finish date times are the same example shown in figure 5 9 13 4 2 then attempting to an...

Page 164: ... Website www chkpowerquality com au Figure 5 9 13 4 4 Figure 5 9 13 4 5 Cursors The user can move the vertical cursors time cursors and then click on the Cursors button The start and finish date times will now reflect the positions of the cursors as shown in figure 5 9 13 4 6 Figure 5 9 13 4 6 If the user now refreshes the existing graph with an updated measurement for example TRMS the graph now d...

Page 165: ...ey Australia ABN 53 169 840 831 Telephone 61 2 8283 6945 Fax 61 2 8212 8105 Website www chkpowerquality com au Figure 5 9 13 4 7 Zoom The user can update start and finish the date times by selecting a portion of the graph using the mouse as shown in figure 5 9 13 4 8 and then clicking on the Zoom button The start and finish date times will now reflect the portion of the display selected by the zoo...

Page 166: ...5 August 2016 Website www chkpowerquality com au Enquiries sales chkpowerquality com au Page 166 Address Unit 1 3 Tollis Place Seven Hills NSW 2147 Sydney Australia ABN 53 169 840 831 Telephone 61 2 8283 6945 Fax 61 2 8212 8105 Website www chkpowerquality com au Figure 5 9 13 4 8 ...

Page 167: ...ite www chkpowerquality com au Figure 5 9 13 4 9 Power up down This feature is only active if there exists a power up or power down event logged If the user attempts to use this feature by clicking on Power Up Down button the message box as shown in figure 5 9 13 4 10 appears Figure 5 9 13 4 10 Figure 5 9 13 4 11 In a file where power up or power down events are logged then clicking on Power Up Do...

Page 168: ...in click on the Power Up Down button to generate a list box showing all the power up and power down events Select the desired power down event as shown in figure 5 9 13 4 14 The finish date time is now updated as shown in figure 5 9 13 4 15 Figure 5 9 13 4 14 Figure 5 9 13 4 15 Reset The user can set the date times back to the default settings by clicking on the Reset button 5 9 13 5 Graphical out...

Page 169: ...3 5 1 5 9 13 6 Timeframes The timeframe of the display can be adjusted using the tools shown in figure 5 9 13 6 1 at the bottom left hand corner beneath the display These tools which include a left arrow right arrow and Set Timeframe buttons are highlighted in figure 5 9 13 6 2 Figure 5 9 13 6 1 The user can set the display to view particular timeframes and include Hour Day Week and Month and whic...

Page 170: ...ustralia ABN 53 169 840 831 Telephone 61 2 8283 6945 Fax 61 2 8212 8105 Website www chkpowerquality com au Figure 5 9 13 6 3 For example selecting Hour from the list will set the time frame to hourly as shown in figure 5 9 13 6 4 Figure 5 9 13 6 4 Clicking on the left arrow or right arrow buttons will shift the displayed timeframe to the left or right by the set timeframe interval in this case hou...

Page 171: ...40 831 Telephone 61 2 8283 6945 Fax 61 2 8212 8105 Website www chkpowerquality com au As shown in figure 5 9 13 7 1 the top of each graph has an event summary which quickly summaries the types of events and when they occurred in time Event types RMS event Waveform event Mains signalling event Power up event Power down event Figure 5 9 13 7 1 The user is able to hide the event summary by unchecking...

Page 172: ...hkpowerquality com au Page 172 Address Unit 1 3 Tollis Place Seven Hills NSW 2147 Sydney Australia ABN 53 169 840 831 Telephone 61 2 8283 6945 Fax 61 2 8212 8105 Website www chkpowerquality com au Figure 5 9 13 7 2 5 9 14 Version number The Citrus software version number is located underneath the logo as shown in figure 5 9 14 1 Figure 5 9 14 1 ...

Page 173: ... is powered from the A phase At least 60V is required for the instrument to start up 6 2 The Miro does not display voltage and or current values Fault The graphic LCD does not display voltage and current measurements Checks 1 Use Citrus to configure the graphic LCD 6 3 The Miro displays incorrect voltage current values Fault Incorrect voltage and current measurements Checks 1 Ensure that the volta...

Page 174: ...y four 24 hours If the problem persists the battery may need replacing and you should return the Miro to CHK Power Quality Pty Ltd 6 5 The Miro does not communicate with the PC using Citrus software Fault Citrus cannot connect to the Miro Checks 1 Check that the data cable is connected to the Miro data connector and to the PC USB 2 0 port 2 Check that no pins on the Miro data cable are broken loos...

Page 175: ...grades and new versions of Citrus 7 3 Technical sales and assistance The Miro PQ25 35 45 instrument is designed and manufactured by CHK Power Quality Pty Ltd and is currently located at Unit 102 25 Angas Street Meadowbank NSW 2114 Australia Please see our website for up to date contact information If you are experiencing any technical issues or require any assistance with the proper use or applica...

Page 176: ...powerquality com au Significantly distort the output voltage waveform and Degradation of voltage stability By connecting a reference meter in parallel with the Miro errors can range from 0 1 up to 1 or more rendering this method unsuitable for verifying the accuracy of a Miro Example Figure 7 4 1 1 1 shows an essentially pure sinusoidal waveform from an unloaded voltage source Figure 7 4 1 1 1 A r...

Page 177: ...kpowerquality com au Page 177 Address Unit 1 3 Tollis Place Seven Hills NSW 2147 Sydney Australia ABN 53 169 840 831 Telephone 61 2 8283 6945 Fax 61 2 8212 8105 Website www chkpowerquality com au Figure 7 4 1 1 2 Figure 7 4 1 1 3 shows the waveform distortion when the voltage source is connected to phase A of the Miro instrument Figure 7 4 1 1 3 ...

Page 178: ...to verify the accuracy of a class A Power Quality meter that requires voltage accuracy better than 0 1 7 4 1 2 Suitable voltage sources Ideally a source designed to supply greater than 15VA and remain stable should be used with a reference meter THD should also be checked during calibration If THD is more than 1 then the source is not suitable The displayed reading should also be checked for stabi...

Page 179: ...es sales chkpowerquality com au Page 179 Address Unit 1 3 Tollis Place Seven Hills NSW 2147 Sydney Australia ABN 53 169 840 831 Telephone 61 2 8283 6945 Fax 61 2 8212 8105 Website www chkpowerquality com au The case of the Miro instrument can be cleaned with a cloth moistened with Isopropyl Alcohol There are no decontamination issues ...

Page 180: ...ted by at least 50dB so as not to interfere with harmonic measurements Measurement metrics Frequency Range 50Hz nominal 42 5 57 5 Hz 60Hz nominal 51 0 69 0 Hz Measurement 10s Accuracy 5mHz referenced to RTC 1mHz referenced to GPS Magnitude of the supply voltage true RMS Measurement 10 12 cycle rms Range 10 to 150 of nominal value with accuracy of 0 1 of nominal value under conditions specified in ...

Page 181: ...ost trigger 400ms Option for extended capture eg motor start Duration 2s Event RMS capture half cycle RMS 2 5s pre trigger 25s post trigger 50Hz Ripple capture 10 12 cycle RMS Duration 1s to 300s Triggered by exceedance of detection threshold see above Communications Wired data standard USB 2 0 Wireless options Local and remote wireless options will be available and integrated within the instrumen...

Page 182: ...of Protection IP66 all weather housing Certifications type testing EMC EN55022 1998 _A1 2000 A2 2003 CLASS A Salt Spray Corrosion MIL STD 810 G Outdoor weathering UV IEEE 495 2007 or equivalent Random Vibration MIL STD 810 G Impact Test IEEE 495 2007 or equivalent Safety Category IEC 61010 1 Pollution degree 3 CAT IV 600V PQ45 model 10kV withstand Power Power supply Phase A voltage range 60 600 VA...

Page 183: ...dices Metrics V0 V1 V50 V99 V100 Voltage Spread V99 V1 Log interval 10 minute duration 1 week K Factor Includes 1 st to 50 th harmonics Triplen harmonics Able to display Triplen currents Harmonic direction Display direction for selected harmonics and referenced to the direction of the Power frequency Symmetrical components For 3 phase configurations display of symmetrical components zero positive ...

Page 184: ...and PQ35 whilst the PC5 is used to power the PQ45 from the Phase A to Neutral connection and accordingly monitors and measures single phase voltage Single phase lead Part number 1APC4 Instrument PQ25 and PQ35 Connection Single phase Power source Phase A to Neutral Termination 3 pin Australian GPO plug Number of wires 3 1 phase N G Weight 200g Cable length 2m Environment Indoor Figure 9 1 1 1 Singl...

Page 185: ... and suitable for indoor and outdoor installations The working voltage between any phase and ground must not exceed 300 V RMS The working voltage between any two phases must not exceed 520 V RMS Each phase of the voltage cable is separately fused and there are various voltage cable attachments available to suit different types of installations 9 1 3 1 VL3 The VL3 is a three phase three wire lead w...

Page 186: ...Number of wires 4 3P N Weight 400g Cable length 2m Environment Indoor outdoor Attachments 1AAC4TE 1AAC4BC Figure 9 1 3 2 1 9 1 3 3 VL4 voltage lead attachments Tinned end fused attachment with fuses Part numbers 1 x AC4TE BK Fused tinned end Black 1 x AC4TE BU Fused tinned end Blue 1 x AC4TE RD Fused tinned end Red 1 x AC4TE WH Fused tinned end White and 4 x FSHD2A10x38 fuse The above parts are no...

Page 187: ...ments VL3 N not required VL4 Figure 9 1 3 3 2 Large fused clamps lfc Part numbers 1 x 1AAC1NCL BK Black lead with lfc 1 x 1AAC1NCL BU Blue lead with lfc 1 x 1AAC1NCL RD Red lead with lfc and 1 x 1AAC1NCL WH White lead with lfc The above parts are normally sold with VL4 as a 1AVL4C2 Instrument PQ25 and PQ35 Connection 3 phase star wye Termination Fused end Number of wires 4 3P N Weight 600g Cable l...

Page 188: ...ase A to Neutral Termination Fused end Number of wires 6 3P 3N Cable length 2m Environment Indoor outdoor Attachments 1AAC6TE 1AAC6BC Figure 9 1 3 4 1 9 1 4 PQ45 three phase leads Three phase leads suitable for the PQ45 are double insulated and UV stabilised and suitable for indoor and outdoor installations The working voltage between any phase and ground must not exceed 600 V RMS The working volt...

Page 189: ...l CAT IV 600V Figure 9 1 4 1 1 Figure 9 1 4 1 2 shows a new addition to the accessories the 1AVL5 B cable using coloured wires banana plugs and crocodile clips Fused three phase lead with banana plugs and detachable small clamps crocodile clips Part number 1AVL5 B Instrument PQ45 Connection 3 phase star wye Power source Phase A to Neutral Termination Banana plugs Number of wires 5 3P N G Weight 95...

Page 190: ...B is a fused three phase eight wire lead that connects to three phase circuits using eight banana plugs as shown in figure 9 1 4 3 1 The lead has separate neutrals and intended as a general connection lead for use on all types of power systems The VL8 lead measures the Phase A to Neutral A Phase B to Neutral B Phase C to Neutral C Ground to Neutral voltages The VL8 B lead is fused with 2A high rup...

Page 191: ... 2 9 1 4 4 VL8 C The VL8 C is a three phase eight wire lead that connects to three phase circuits using eight large fused clamps as shown in figure 9 1 4 4 1 The lead has separate neutrals and intended as a general connection lead for use on all types of power systems The VL8 lead measures the Phase A to Neutral A Phase B to Neutral B Phase C to Neutral C Ground to Neutral voltages The VL8 C clamp...

Page 192: ... high sensitivity coil F 500 3000 Red Flexible high sensitivity coil F 500 3000 Red Part number 1AFF3000 6 H Instrument PQ25 and PQ35 Output signal 250mV 500A 50Hz Frequency range 20Hz to 5kHz Accuracy 1 Calibrated Linearity 0 2 Calibrated Coil length 600mm Weight 300g Cable length 2m Environment Indoor outdoor Protection level CAT IV 600V Colour Red Figure 9 2 1 1 1 9 2 1 2 Flexible coil 3000 Blu...

Page 193: ...ible coil 3000 Green Part number 1AFF3000 6 3000A Instrument PQ25 and PQ35 Output signal 78mV kA 50Hz Frequency range 10Hz to 20kHz Accuracy 0 5 Calibrated Linearity 0 2 Calibrated Coil length 610mm Weight 300g Cable length 2m Environment Indoor outdoor Protection level CAT IV 600V Colour Green Figure 9 2 1 3 1 9 2 1 4 Clamp on CT probes 52mm 100A Clamp on CT probe 52mm 100A Instrument PQ25 and PQ...

Page 194: ...au 9 2 1 5 Clamp on CT probes 52mm 500A Clamp on CT probe 52mm 500A Instrument PQ25 and PQ35 Part number 1ACR500 Accuracy 0 5 Cable diameter 52mm Rated current 500Arms Frequency range 5Hz 5kHz Weight 750g Cable length 1 95m Protection level CAT IV 600V Figure 9 2 1 5 1 9 2 1 6 Clamp on CT probes 52mm 1000A Clamp on CT probe 52mm 1000A Instrument PQ25 and PQ35 Part number 1ACR1000 Accuracy 0 5 Cabl...

Page 195: ...5mm 100A Instrument PQ25 and PQ35 Part number 1ACR100S Accuracy 1 Cable diameter 15mm Rated current 100Arms Frequency range 45Hz 5kHz Safety rating 600V CAT III Weight 113g excluding lead Cable length 1 95m Figure 9 2 1 7 1 9 2 1 8 Clamp on AC DC probes 50mm DC probes are intended for monitoring currents in DC systems Clamp on AC DC Probe 50mm Instrument PQ25 and PQ35 Part number 1ADCR500 Cable di...

Page 196: ...sitivity coil F 500 3000 Red Part number 1AF3000 6 H Instrument PQ45 Output signal 250mV 500A 50Hz Frequency range 20Hz to 5kHz Accuracy 1 Calibrated Linearity 0 2 Calibrated Coil length 600mm Weight 300g Cable length 2m Environment Indoor outdoor Protection level CAT IV 600V Colour Red Figure 9 2 2 1 1 9 2 2 2 Flexible coil 3000 Blue Flexible coil 3000 Blue Part number 1AF3000 6 3000A Instrument ...

Page 197: ...reen Flexible coil 3000 Green Part number SAF3000_6B 3000A Instrument PQ45 Output signal 78mV kA 50Hz Frequency range 10Hz to 20kHz Accuracy 0 5 Calibrated Linearity 0 2 Calibrated Coil length 610mm Weight 300g Cable length 2m Environment Indoor outdoor Protection level CAT IV 600V Colour Green Figure 9 2 2 3 1 9 2 2 4 Clamp on CT probes 52mm 100A Clamp on CT probe 52mm 100A Instrument PQ45 Part n...

Page 198: ...lity com au 9 2 2 5 Clamp on CT probes 52mm 500A Clamp on CT probe 52mm 500A Instrument PQ45 Part number 1ASC500 Accuracy 0 5 Cable diameter 52mm Rated current 500Arms Frequency range 5Hz 5kHz Weight 750g Cable length 1 95m Protection level CAT IV 600V Figure 9 2 2 5 1 9 2 2 6 Clamp on CT probes 52mm 1000A Clamp on CT probe 52mm 1000A Instrument PQ45 Part number 1ASC1000 Accuracy 0 5 Cable diamete...

Page 199: ... au 9 2 2 7 Clamp on CT probes 15mm 10A Clamp on CT probe 15mm 10A Instrument PQ45 Part number 1AC10 Accuracy 1 Cable diameter 15mm Rated current 10Arms Frequency range 45Hz 5kHz Safety rating 600V CAT III Weight 113g excluding lead Cable length 1 95m Figure 9 2 2 7 1 9 2 2 8 Clamp on CT probes 15mm 100A Clamp on CT probe 15mm 100A Instrument PQ45 Part number 1AC100S Accuracy 1 Cable diameter 15mm...

Page 200: ...9 840 831 Telephone 61 2 8283 6945 Fax 61 2 8212 8105 Website www chkpowerquality com au 9 2 2 9 Clamp on AC DC probes 50mm DC probes are intended for monitoring currents in DC systems Clamp on AC DC Probe 50mm Instrument PQ45 Part number 1ADC500 Cable diameter 50mm Rated current 500A Upper frequency 10kHz 3dB Safety rating CAT III 600V Power source Directly from the Miro no external power supply ...

Page 201: ... ABN 53 169 840 831 Telephone 61 2 8283 6945 Fax 61 2 8212 8105 Website www chkpowerquality com au 9 3 Temperature probes Temperature probes for T1 and T2 inputs Two types are available Temperature probe ambient Instrument PQ25 PQ35 and PQ45 Part number 1ATEMPSENAMB Weight 150g Cable length 3m Figure 9 3 1 Temperature probe surface Instrument PQ25 PQ35 and PQ45 Part number 1ATEMPSENSUR magnetic mo...

Page 202: ...ount Input DC voltage 2 5V 12V DC current 11mA 13mA Operating frequency range 1 575 42MHz Weight 100g Cable length 3m Figure 9 4 1 1 9 4 2 Cellular antennas T bar penta band cellular antenna Instrument PQ25 PQ35 and PQ45 Part number TBA Cellular technologies GSM CDMA PCS DCS UMTS WCDMA IP rating IP67 waterproof Dimensions L x W x H mm 105 7 x 14 x 6 5 Weight 40g Figure 9 4 2 1 Instrument PQ25 PQ35...

Page 203: ...nt PQ25 PQ35 and PQ45 Part number 1ADC12VPS Input voltage 110 240Vrms Rated output DC current 1 5A Output DC voltage 12V Mains frequency range 50 60Hz Weight 150g Cable length 1 8m Figure 9 5 1 1 9 5 2 Communications cable USB Lead Instrument PQ25 PQ35 and PQ45 Part number 1AUSBMINIB a mini B connector Weight 50g Cable length 2m Figure 9 5 2 1 9 5 3 Carry bag Carry bag Instrument PQ25 PQ35 and PQ4...

Page 204: ...2 8105 Website www chkpowerquality com au 10 Instrument voltage connector pinouts 10 1 PQ25 and PQ35 The voltage leads use an 8 way connector with pin numbers shown below Connector on the instrument The connection tables are given below VL4 Description Pin number Phase A 1 Phase B 2 Phase C 2 Neutral 4 5 6 VL6 Description Pin number Phase A 1 Neutral A 4 Phase B 2 Neutral B 5 Phase C 3 Neutral C 6...

Page 205: ... voltage leads use an 8 way connector with pin numbers shown below Connector on the instrument The connection tables are given below VL5 B VL5 C Description Pin number Phase A 1 Phase B 3 Phase C 5 Ground 7 Neutral 2 4 6 8 VL8 B Description Pin number Phase A 1 Neutral A 2 Phase B 3 Neutral B 4 Phase C 5 Neutral C 6 Ground 7 Neutral 8 PC5 Description Pin number Australasia GPO pins Phase A 1 Activ...

Page 206: ...s The Miro Power Quality Analyser supports the following connections Star Wye Delta Split phase Single phase and Generic independent measurements 11 1 Star Wye 11 1 1 Three phase 4 wire Wye source with Wye load VL4 cable a Connection diagram using 4 Wire Voltage Cable VL4 b NC not connected Circuit summary table Voltage lead connection Source Star Wye Phase A Red Load Star Wye Phase B White Connec...

Page 207: ...83 6945 Fax 61 2 8212 8105 Website www chkpowerquality com au 11 1 2 Three phase 4 wire Wye source with Wye load VL5 cable a Connection diagram using 5 Wire Voltage Cable VL5 b NC not connected Circuit summary table Voltage lead connection Source Star Wye Phase A Red Load Star Wye Phase B White Connection type Star Wye Phase C Blue Nominal RMS Phase Neutral Neutral Black Gnd Green Voltage Current ...

Page 208: ...ebsite www chkpowerquality com au 11 1 3 Three phase 4 wire Wye source with Wye load VL6 cable a Connection diagram using 6 Wire Voltage Cable VL6 b NC not connected Circuit summary table Voltage lead connection Source Star Wye Phase A Red Load Star Wye Neutral A Red Black Connection type Star Wye Phase B White Nominal RMS Phase Neutral Neutral B White Black Phase C Blue Neutral C Blue Black Volta...

Page 209: ...1 2 8283 6945 Fax 61 2 8212 8105 Website www chkpowerquality com au 11 2 Delta 11 2 1 Three phase 3 wire Delta source with Delta load VL3 cable a Connection diagram using 3 Wire Voltage Cable VL3 b NC not connected Circuit summary table Voltage lead connection Source Delta Phase A Red Load Delta Phase B White Connection type Delta Phase C Blue Nominal RMS Phase Phase Voltage Current A B C N Source...

Page 210: ...w chkpowerquality com au 11 2 2 Three phase 3 wire Delta source with Delta load VL6 cable a Connection diagram using 6 Wire Voltage Cable VL6 b NC not connected Circuit summary table Voltage lead connection Source Delta Phase A Red Load Delta Neutral A Red Black Connection type Delta Phase B White Nominal RMS Phase Phase Neutral B White Black Phase C Blue Neutral C Blue Black Voltage Current A B C...

Page 211: ... chkpowerquality com au 11 2 3 Three phase 3 wire Delta source with Delta load VL8 cable a Connection diagram using 8 Wire Voltage Cable VL8 b NC not connected Circuit summary table Voltage lead connection Source Delta Phase A Phase A Load Delta Neutral A Neutral A Connection type Delta Phase B Phase B Nominal RMS Phase Phase Neutral B Neutral B Phase C Phase C Neutral C Neutral C Gnd Gnd Neutral ...

Page 212: ... 61 2 8283 6945 Fax 61 2 8212 8105 Website www chkpowerquality com au 11 2 4 Three phase 2 Watt 3 wire Delta source with Delta load VL3 cable a Connection diagram using 3 Wire Voltage Cable VL3 b NC not connected Circuit summary table Voltage lead connection Source Delta Phase A Red Load Delta Phase B White Connection type Delta Phase C Blue Nominal RMS Phase Phase Voltage Current A B C N Source L...

Page 213: ...hkpowerquality com au 11 2 5 Three phase 2 Watt 3 wire Delta source with Delta load VL6 cable a Connection diagram using 6 Wire Voltage Cable VL6 b NC not connected Circuit summary table Voltage lead connection Source Delta Phase A Red Load Delta Neutral A Red Black Connection type Delta Phase B White Nominal RMS Phase Phase Neutral B White Black Phase C Blue Neutral C Blue Black Voltage Current A...

Page 214: ...powerquality com au 11 2 6 Three phase 2 Watt 3 wire Delta source with Delta load VL8 cable a Connection diagram using 8 Wire Voltage Cable VL8 b NC not connected Circuit summary table Voltage lead connection Source Delta Phase A Phase A Load Delta Neutral A Neutral A Connection type Delta Phase B Phase B Nominal RMS Phase Phase Neutral B Neutral B Phase C Phase C Neutral C Neutral C Gnd Gnd Neutr...

Page 215: ...Fax 61 2 8212 8105 Website www chkpowerquality com au 11 3 Split phase 11 3 1 Split phase 3 wire with 2 single phase loads VL4 cable a Connection diagram using 4 Wire Voltage Cable VL4 b NC not connected Circuit summary table Voltage lead connection Source Split phase Phase A Red Load 2 Single phase Phase B White Connection type Star Wye Phase C Blue Nominal RMS Phase Neutral Neutral Black NC Volt...

Page 216: ... 6945 Fax 61 2 8212 8105 Website www chkpowerquality com au 11 3 2 Split phase with 2 single phase loads VL5 cable a Connection diagram using 5 Wire Voltage Cable VL5 b NC not connected Circuit summary table Voltage lead connection Source Split phase Phase A Red Load 2 Single phase Phase B White Connection type Star Wye Phase C Blue Nominal RMS Phase Neutral Neutral Black Gnd Green Voltage Current...

Page 217: ...w chkpowerquality com au 11 3 3 Split phase 3 wire with 2 single phase loads VL6 cable a Connection diagram using 6 Wire Voltage Cable VL6 b NC not connected Circuit summary table Voltage lead connection Source Split phase Phase A Red Load 2 Single phases Neutral A Red Black Connection type Wye Phase B White Nominal RMS Phase Neutral Neutral B White Black Phase C Blue Neutral C Blue Black Voltage ...

Page 218: ...61 2 8283 6945 Fax 61 2 8212 8105 Website www chkpowerquality com au 11 4 Single phase 11 4 1 Single phase VL4 cable a Connection diagram using a 4 Wire Voltage Cable VL4 b NC not connected Circuit summary table Voltage lead connection Source Single Phase Phase A Red Load Single Phase Phase B White Connection type Star Wye Phase C Blue Nominal RMS Phase Neutral Neutral Black Voltage Current A B C ...

Page 219: ...e 61 2 8283 6945 Fax 61 2 8212 8105 Website www chkpowerquality com au 11 4 2 Single phase VL5 cable a Connection diagram using a 5 Wire Voltage Cable VL5 b NC not connected Circuit summary table Voltage lead connection Source Single Phase Phase A Red Load Single Phase Phase B White Connection type Star Wye Phase C Blue Nominal RMS Phase Neutral Neutral Black Gnd Green Voltage Current A B C N Sour...

Page 220: ...5 Website www chkpowerquality com au 11 4 3 Single phase VL6 cable a Connection diagram using a 6 Wire Voltage Cable VL6 b NC not connected Circuit summary table Voltage lead connection Source Single Phase Phase A Red Load Single Phase Neutral A Red Black Connection type Star Wye Phase B White Nominal RMS Phase Neutral Neutral B White Black Phase C Blue Neutral C Blue Black Voltage Current A B C N...

Page 221: ...05 Website www chkpowerquality com au 11 5 Generic 11 5 1 3 independent circuits VL6 cable a Connection diagram using 6 Wire Voltage Cable VL6 b NC not connected Circuit summary table Voltage lead connection Source Generic Phase A Red Load 3 Single phases Neutral A Red Black Connection type Star Wye Phase B White Nominal RMS Phase Neutral Neutral B White Black Phase C Blue Neutral C Blue Black Vol...

Page 222: ...w chkpowerquality com au 11 5 2 4 independent circuits VL8 cable a Connection diagram using 8 Wire Voltage Cable VL8 b NC not connected Circuit summary table Voltage lead connection Source Generic Phase A Phase A Load 4 Single phases Neutral A Neutral A Connection type Star Wye Phase B Phase B Nominal RMS Phase Neutral Neutral B Neutral B Phase C Phase C Neutral C Neutral C Gnd Gnd Neutral Neutral...

Reviews: