Programmable DC Power Supply (with Solar Array Simulation) 62000H Series
Operating & Programming Manual
3-88
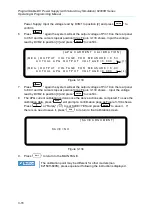
(c) (d)
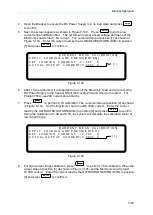
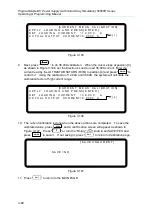
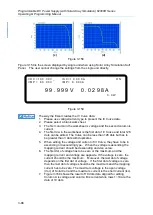
Figure 3-158
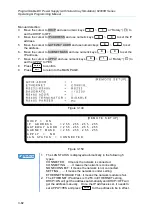
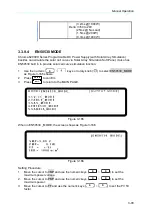
Figure 3-159 is the screen displayed by single unit when using Solar Array Simulation Soft
Panel. The user cannot change the settings from the single unit directly.
V O C = 1 0 0 . 0 0 V _ I S C = 1 0 . 0 0 0 A O N
V M P = 6 0 . 0 0 V I M P = 6 . 0 0 0 A
9 9 . 9 9 9 V 0 . 0 2 9 8 A
3 . 0 W
Figure 3-159
The way the Excel creates the IV Curve data:
1.
Please use voltage/current type to present the IV Curve data.
2.
Please select a blank work sheet.
3.
The first column in the worksheet is voltage and the second column is
current.
4.
The first row in the worksheet is the first dot of IV Curve and total 128
dots can be edited. The Curve can be less than 128 dots but has to
be greater than 3 dots with duplicates.
5.
When editing the voltage and current of IV Curve, they have to be in
ascending or descending type. When the voltage is ascending the
mapping current should be descending and vice versa.
6.
The first dot of voltage has to be zero or the maximum and the
mapping current and voltage are opposite. If the voltage is zero, the
current should be the maximum. Moreover, the last dot of voltage
depends on the first dot of voltage. If the first dot of voltage is zero
then the last dot of voltage should be the maximum and the mapping
current has to be zero. The maximum voltage is the open voltage
(Voc) of Solar Cell and the maximum current is the short current (Isc).
7.
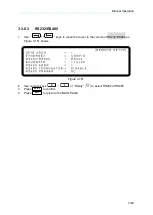
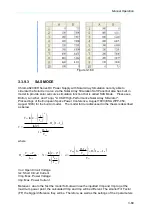
Figure 3-160 shows the result of 10 dots data aligned for editing.
Column A is voltage and column B is current while rows 1~10 are the
data of 10 dots.

