11-17
Cisco ASA Series Firewall CLI Configuration Guide
Chapter 11 Connection Settings
Monitoring Connections
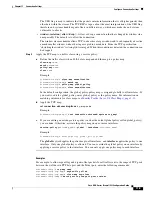
Step 8
If you are editing an existing service policy (such as the default global policy called global_policy), you
are done. Otherwise, activate the policy map on one or more interfaces.
service-policy
policymap_name
{
global
|
interface
interface_name
}
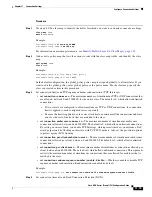
Example:
hostname(config)# service-policy global_policy global
The
global
keyword applies the policy map to all interfaces, and
interface
applies the policy to one
interface. Only one global policy is allowed. You can override the global policy on an interface by
applying a service policy to that interface. You can only apply one policy map to each interface.
Examples
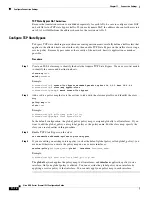
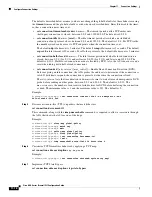
The following example sets the connection limits and timeouts for all traffic:
hostname(config)#
class-map CONNS
hostname(config-cmap)#
match any
hostname(config-cmap)#
policy-map CONNS
hostname(config-pmap)#
class CONNS
hostname(config-pmap-c)#
set connection conn-max 1000 embryonic-conn-max 3000
hostname(config-pmap-c)#
set connection timeout idle 2:0:0 embryonic 0:40:0
half-closed 0:20:0 dcd
hostname(config-pmap-c)#
service-policy CONNS interface outside
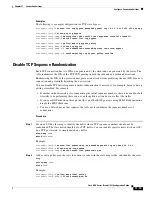
You can enter
set connection
commands with multiple parameters or you can enter each parameter as a
separate command. The ASA combines the commands into one line in the running configuration. For
example, if you entered the following two commands in class configuration mode:
hostname(config-pmap-c)#
set connection conn-max 600
hostname(config-pmap-c)#
set connection embryonic-conn-max 50
The output of the
show running-config policy-map
command would display the result of the two
commands in a single, combined command:
set connection conn-max 600 embryonic-conn-max 50
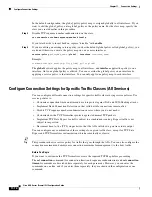
Monitoring Connections
You can use the following commands to monitor connections:
•
show conn
Shows connection information. The “b” flag indicates traffic subject to TCP State Bypass.
•
show service-policy
Shows service policy statistics, including Dead Connection Detection (DCD) statistics.
•
show threat-detection statistics top tcp-intercept
[
all
|
detail
]
View the top 10 protected servers under attack. The
all
keyword shows the history data of all the
traced servers. The
detail
keyword shows history sampling data. The ASA samples the number of
attacks 30 times during the rate interval, so for the default 30 minute period, statistics are collected
every 60 seconds.
Summary of Contents for ASA 5512-X
Page 5: ...P A R T 1 Service Policies and Access Control ...
Page 6: ......
Page 51: ...P A R T 2 Network Address Translation ...
Page 52: ......
Page 127: ...P A R T 3 Application Inspection ...
Page 128: ......
Page 255: ...P A R T 4 Connection Settings and Quality of Service ...
Page 256: ......
Page 303: ...P A R T 5 Advanced Network Protection ...
Page 304: ......
Page 339: ...P A R T 6 ASA Modules ...
Page 340: ......


