42 |
VinciLab User’s Guide
•
To automatically determine the fit:
-
tap
, Coach automatically estimates the best initial parameter values of the fit
function; in some cases this is already the optimal fit.
-
tap
to refine the suggested fit.
•
To manually determine the fit:
-
When the pin “is opened” you can shift the fit-function around. Touch the fit-
function and move up/down and left/right.
-
When the pin “is closed” you can shape the fit-function around the fixed
pinpoint. Tap the pin to close it, touch the fit-function and stretch up/down and
left/right.
-
Repeat the above steps until a satisfying result is obtained.
•
Tap
to confirm.
•
Select
Add graph
or
Replace graph
.
•
Tap
to confirm or
to close the dialog without changes.
12.8. Signal Analysis
The
Signal Analysis
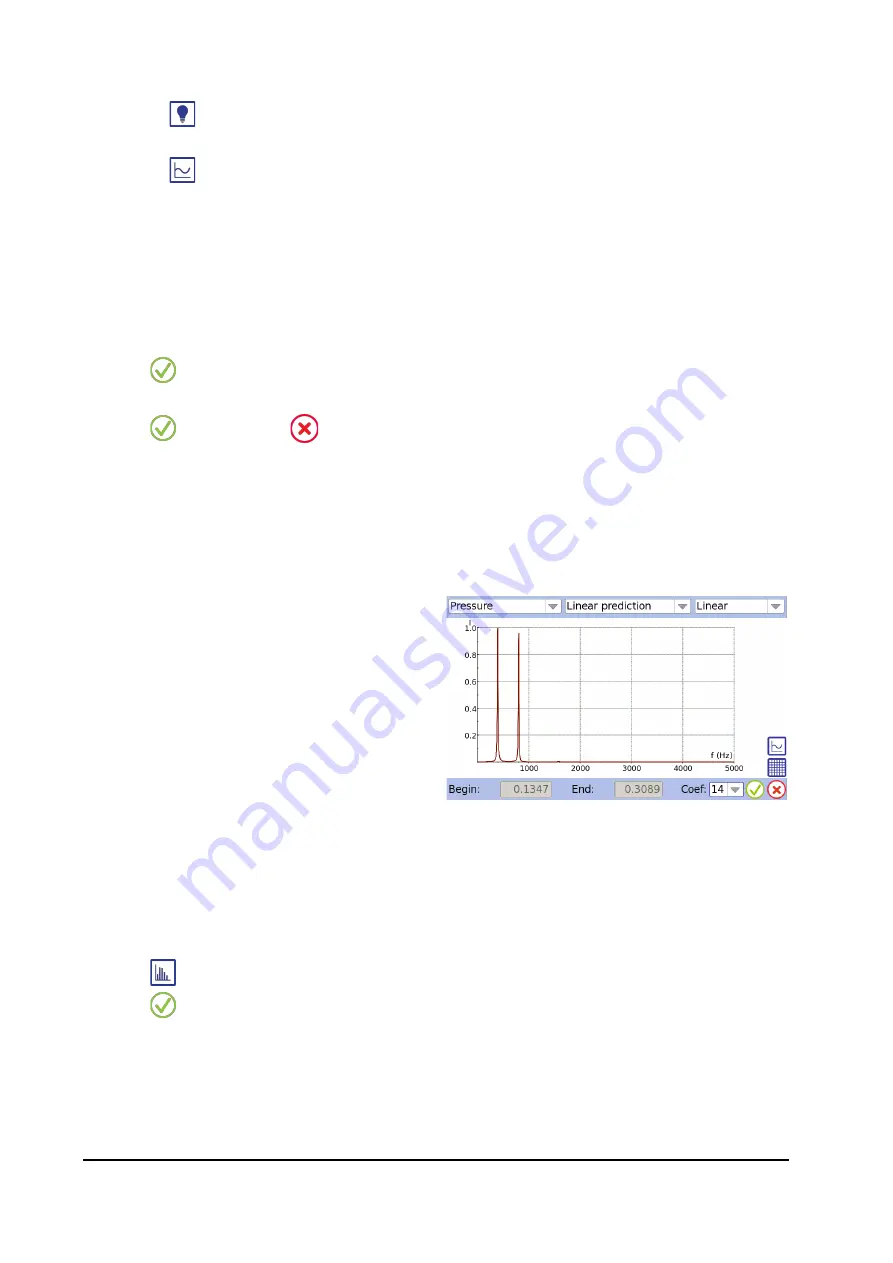
tool is used to find the frequency spectrum of a periodical signal.
The resulting values are presented as amplitudes plotted versus the frequency.
To determine a frequency spectrum
•
Select
Process/Analyze > Signal
Analysis
.
•
In the top left drop-down list select the
graph of which you want to calculate
the frequency spectrum.
•
In the next drop-down list select the
method:
Fourier transform or Linear
prediction.
•
In the third drop-down list select
Linear
or
Logarithmic
for the intensity scale along the y-axis.
•
The diagram shows two boundary lines between which the spectrum is calculated.
Drag the boundary lines to the required position, or type the x-values for the
boundary lines in the
Begin
and
End
fields.
•
For
Linear Prediction
enter the number of coefficients. This number determines the
maximum number of peaks (formants), which will be found in the spectrum.
•
Tap
to display the frequency spectrum of the signal.
•
Tap
to confirm.
•
Tap
OK
again to confirm creating a new diagram or
Cancel
to return to Signal
Analysis.


