51
i) Moon phases
By means of the DCF date (or the manually set date) the weather station calculates the present moon phase (valid
for the years 2000-2099).
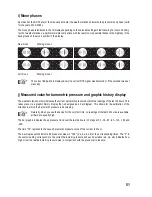
The moon phase is indicated in the LC display depending on the calendar settings in the following 12 levels. Contrary
to other weather stations, a particular simple comparison with the real moon is possible thanks to the night sky in the
background of the moon symbol in the display.
New moon
Waxing moon >
Full moon
Waning moon >
The correct indication is displayed only if a correct DCF signal was detected or if the calendar was set
manually.
j) Measured value for barometric pressure and graphic history display
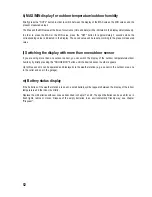
The weather station not only indicates the current barometric pressure but also the readings of the last 24 hours. This
takes place via a graphic history display that is designed as a bar diagram. This allows for the estimation of the
direction in which the barometric pressure is developing.
Naturally, when you use the device for the very first time, no readings of the last 24 hours are available,
all bars are equally high.
The bar graphic indicates the air pressure trend over the last 24 hours in 7 steps at 0h, -3h, -6h, -9h, -12h, -18h and
-24h.
The time "0h" represents the saved barometric pressure value of the current full hour.
The bars represent the barometric pressure values in "hPa" (0, ±2, ±4, ±6) at the corresponding times. The "0" in
the center reading corresponds to the current barometric pressure and each deviation (±2, ±4, ±6) indicates how
high or low the last barometric pressure was in comparison with the present air pressure.

