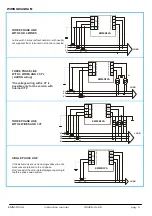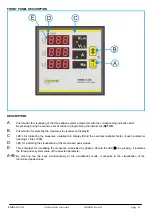
EMM-R3 VA
instruction manual
IM425-U v2.0
pag. 6
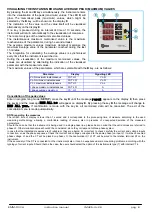
VISUALISING THE INSTANTANEOUS AND AVERAGE PEAK (MAXIMUM) VALUES
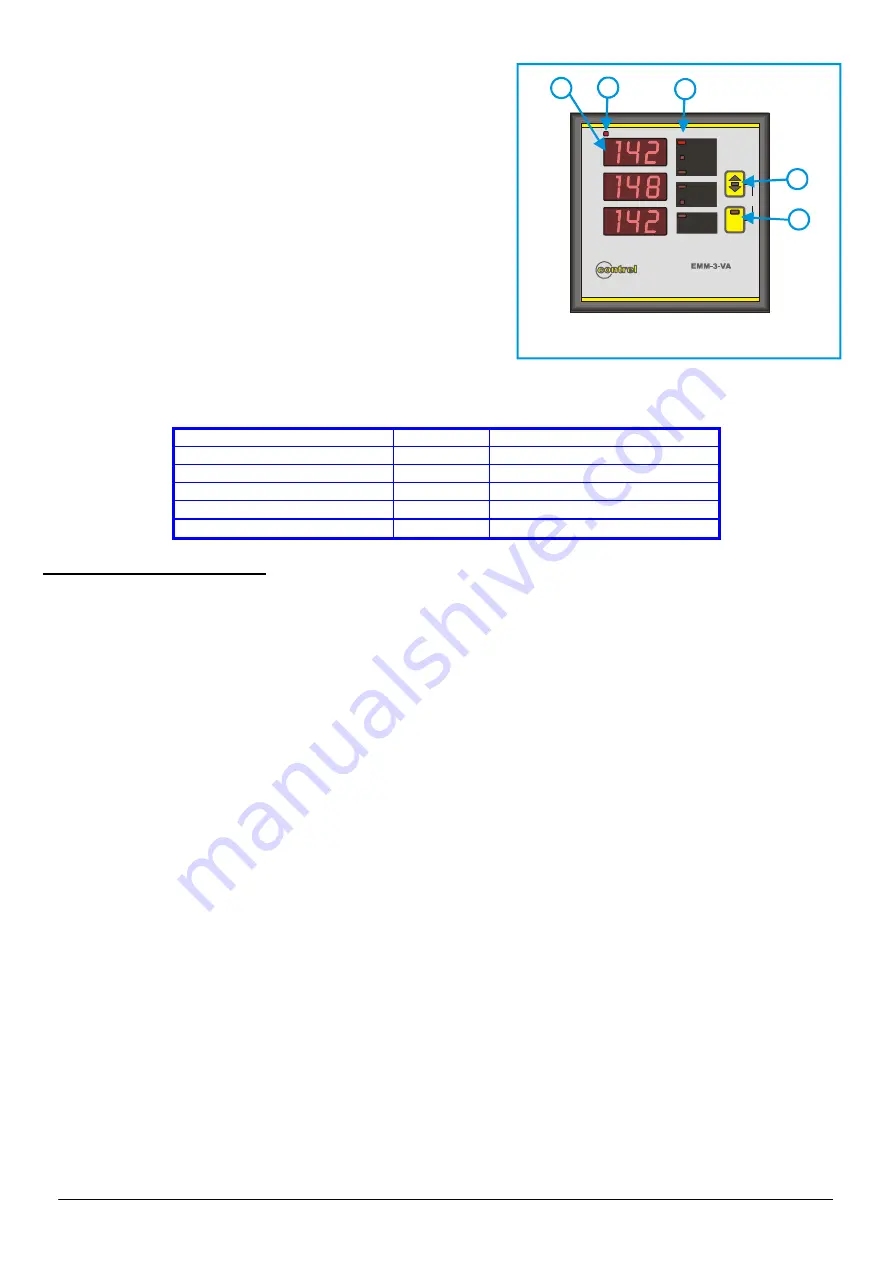
By pressing the
A
and
B
keys simultaneously, the instrument enters
into the visualisation of the peak (maximum) values: The LED
D
will
glow. The memorised peak (maximum) values, which might be
selected by the
B
key, will be shown on the display
E
.
The indication of the value and the value itself will be visualised
alternatively on the display
E
.
If no key is pressed during an interval of time of 10 seconds, the
instrument will return automatically to the visualisation of measures.
There are two types of the maximum memorised values:
The instantaneous maximum memorised value is the maximum
reached value of the parameter, during 1-second al least.
The average maximum values (maximum demand) memorise the
maximum average value of the parameter, reached during the last
15 minutes.
The integration for calculating the average values is synchronised
every time that the instrument is switched on.
During the visualisation of the maximum memorised values, the
values are visualised by alternating the indication of the visualised
parameter with the measured values.
The maximum values of the parameters, which are selectable with the
B
key, are as follows:
Parameter
Display
Signalling LED
VL-N maximum instantaneous
IST HI
VL-N
VL-N minimum instantaneous
IST LO
VL-N
VL-L maximum instantaneous
IST HI
VL-L
I phase maximum instantaneous
IST LO
A
I phase average maximum
15’ HI
A
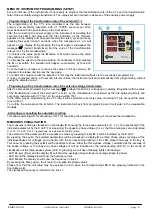
Cancellation of the peak values
Enter in programming mode (
SETUP
), press the key
B
until the message
reset
appears on the display
E
, then press
the key
A
and the message
RES ALL no
will appear on display
E
. By pressing the key
B
the message will change to
RES ALL yes.
If confirmation is made with the key
A
, all memorised data will be cancelled. The exit of the
cancellation menu is made automatically.
NOTE regarding the measures
The refresh time of display is lower than 1 second and it corresponds to the processing time of measure according to the used
measuring methodology, allowing a comfortable reading of values, also in presence of unexpected deviation of the measured
parameters.
Should the case be that the instrument is being used in a single-phase line, please bear on mind that the valid values are referred to
phase L3. Other visualised values shouldn’t be considered, since they correspond to three-phase system.
In case that the indicated measures aren’t reliable or they are absurd, it’s important to check carefully the current and voltage inputs
connection, so as the phase sequence. Check that current and voltage correspond to the same phase (on input L1 it will be connected
phase voltage L1 and the CT will be placed on phase L1), thence terminal S1 of CT will be wired to the relative terminal S1 on the
instrument.
If the secondary of the CT is connected to other instruments also, it can be experienced some measuring problems, according with the
typology of current inputs. Should that be the case, the user should select the option of the instruments type (T) with internal CT’s.
B
C
C
E
A
L1
L2
L3
Σ
L
V
L-N
V
L-L
A
electrical multi meter
L1-2
L2-3
L3-1
MAX
Hz
k
max
avg
k
D


