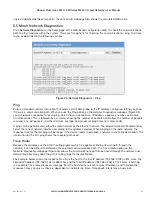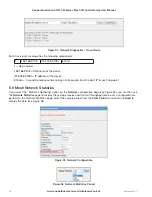
www.cooperbussmann.com/wirelessresources
Cooper Bussmann 915U-2 Wireless Mesh I/O and Gateway User Manual
87
Rev Version 1.2.2
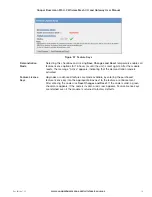
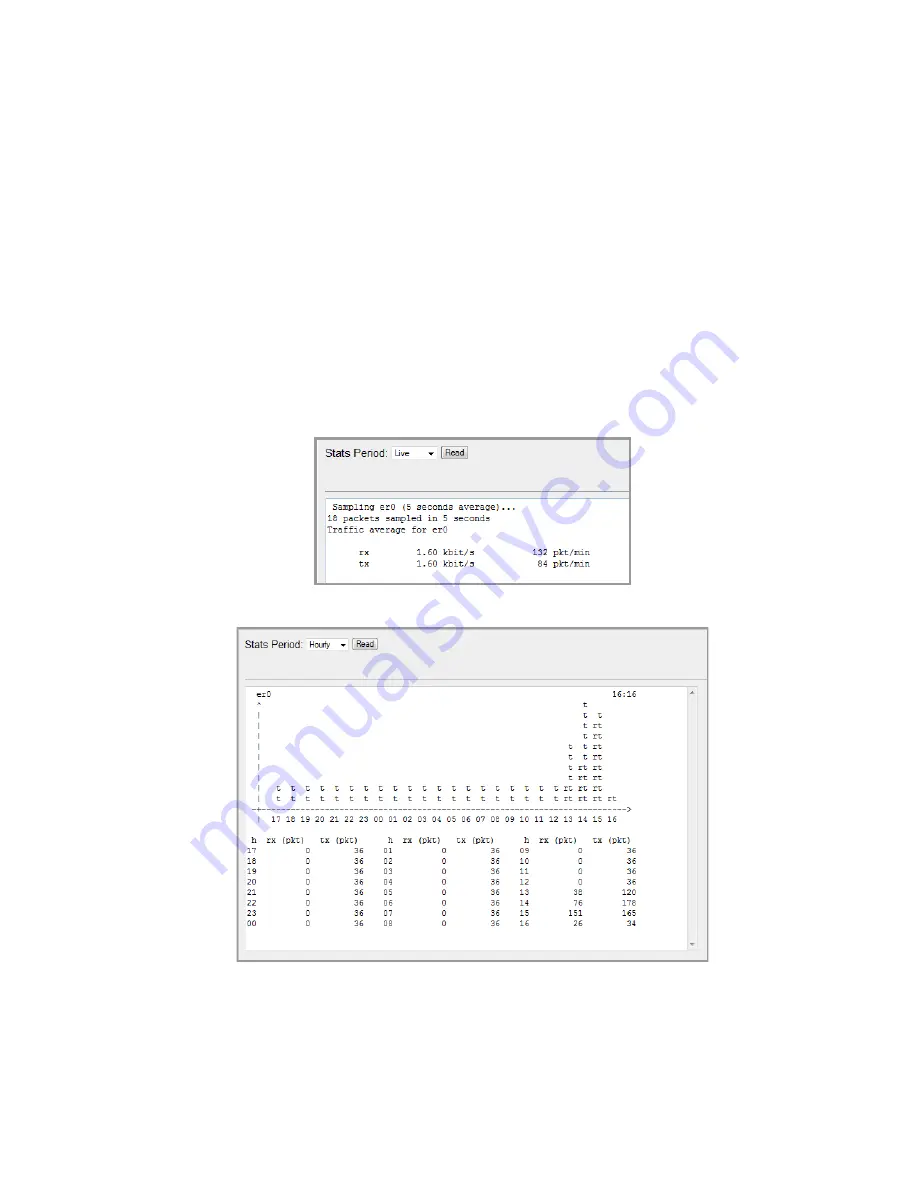
Stats Period
The sample period. Select one of the following options:
•
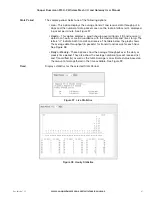
Live
—This option displays the average transmit and receive data through put in
kbps and the number of data packets seen on the radio interface (er0), displayed
in packet per minute. See Figure 97.
•
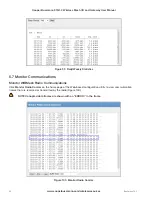
Hourly
— This option displays a graph showing overall transmit (t) and receive (r)
data on an hourly scale in accordance with the module Date and time stamp. The
letters “rt” indicate both transmit and receive. The table below the graph shows
the average data throughput (in packets) for transmit and receive for each hour.
See Figure 98.
•
Daily
or
Weekly
—These options show the average throughput over the daily or
weekly time period. They also show the average number of packet received (rx)
and Transmitted (tx) as well as the total. Average is an estimated value based on
the amount of data gathered in the time available. See Figure 99.
Read
Displays statistics for the selected Stats Period.
Figure 97 Live Statistics
Figure 98 Hourly Statistics

