MOBILTEX® DATA LTD.
Calgary, Alberta
www.corTalk.com
TITLE:
uDL2 Configuration and Operation Guide
DOCUMENT NO.:
UDL2-MAN-001
SHEET:
21 of 28
REV:
1.07
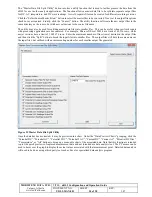
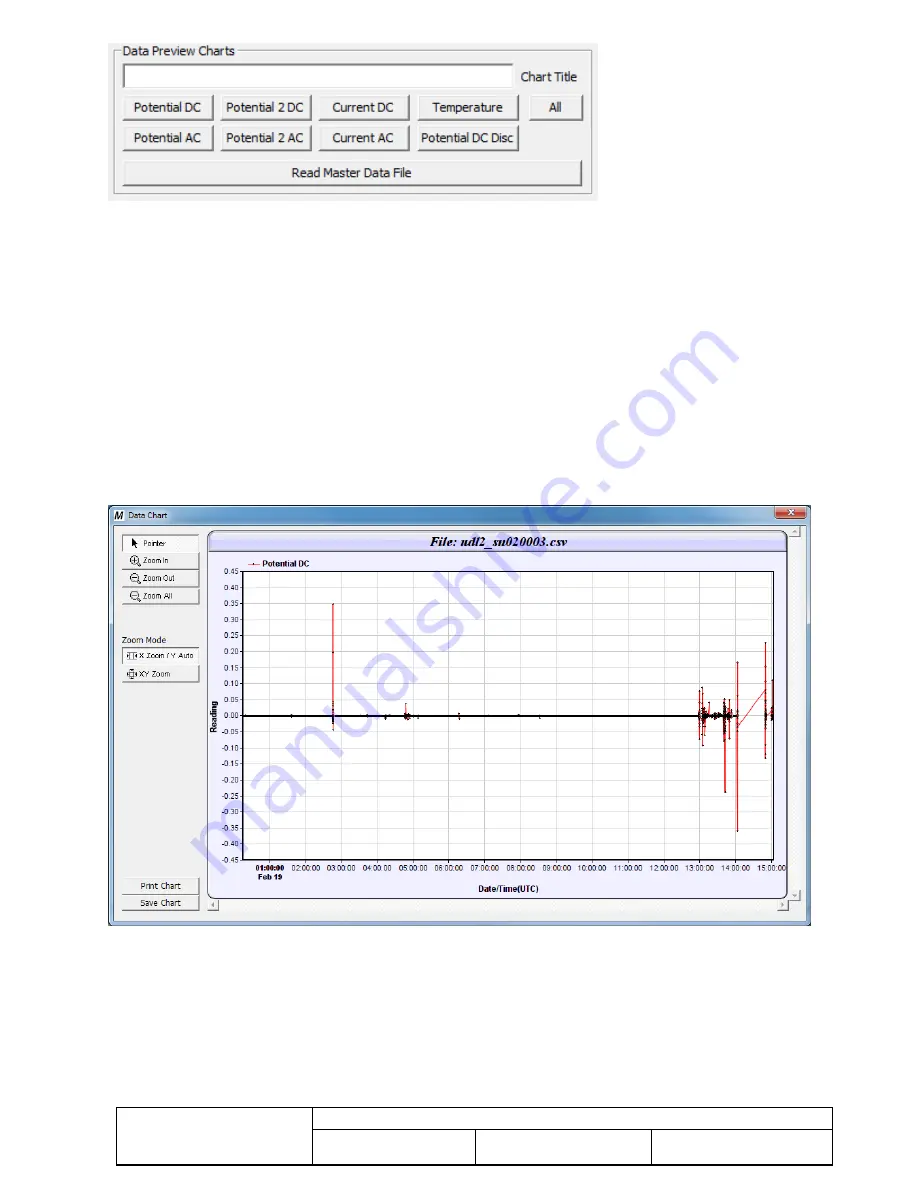
Figure 26 Data Preview Charts Selection
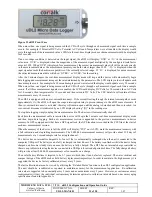
The current chart display may be zoomed in by selecting the “Zoom In” button and then clicking on the chart. Each
click zooms the chart in further. The zoom-in mode may be changed between “X Zoom/Y Auto” and “XY Zoom”. If
“X Zoom/Y Auto” mode is selected, the Y-axis scale is automatically adjusted to the data being displayed. If “XY
Zoom” mode is selected, then both the X and Y-axes are both zoomed in with each click on the chart.
To zoom out, select the “Zoom Out” button and click on the chart. Again, each click zooms out the chart further. If a
view of the entire data set is desired, click on the “Zoom All” button.
When viewing DC Wave capture segments, the currently displayed data segment may be selected by clicking the
‘Previous’, ‘Next’, ‘First’ or ‘Last’ buttons under the ‘Wave Print Segment’ area. These buttons do not appear for other
preview chart types.
The current chart view may be saved to a file. Click the “Save Chart” button to save a bitmap of the chart. The bitmap
may be saved in JPEG, BMP, WBMP, PNG, GIF, SVG or SVGZ formats by selecting the appropriate type in the save
file dialog.
The current chart view may also be printed by clicking the “Print Chart” button.
Figure 27 Sample Data Preview Chart
The “Read Master Data File” button can be used to load a previously stored measurement file into the data chart memory.
Data charts can be printed and saved.
After the data has been extracted from the uDL2, the data memory on the device may be cleared by clicking the “Clear
Memory” button. Note that clearing memory may take up to 60s to complete.

