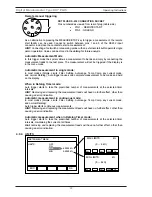
HINT:
STATS will only be calculated and displayed from measurements with the same
measuring conditions. E.g. Changing ranges will prohibit the STATS display.
4.9.7
GRAPHICS
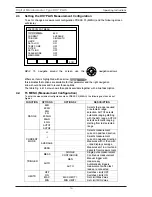
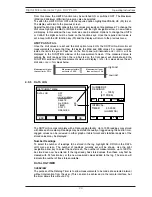
The DO7PLUS has the ability to plot graphs from the logged values. Once the datalog has
been configured and values stored, select the GRAPHICS option from the DATA LOG menu
screen using the right navigation arrow.
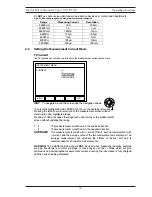
PRESS F3 (DATA RANGE) and enter the logged data numbers in the FROM /TO dialog box
and PRESS F5 (OK) to accept.
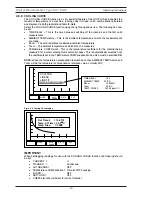
To select the graph type PRESS F2 (MODE) the dialog box allows the following selection.
x
SCATTER
x
LINEAR
x
LINE FIT
x
COOLING CURVE
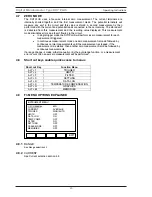
For the COOLING CURVE additional data needs to be set up but for the other three options
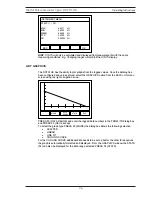
the graph is automatically formatted and displayed. From the GRAPHICS window the STATS
(F4) can also be displayed for the data range selected PRESS F4 (STATS).
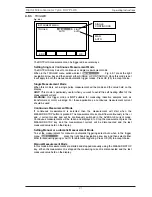
INSTRUMENT MENU
STATS (1 – 29):
MAX :
4.9971 k
MIN :
4.9939 k
MEAN :
4.9948 k
PTP :
0.0032 k
SD :
0.00056 k
ESC
OK
MODE
EXIT
DATA
RANGE
STATS
Operating Instructions
Digital Microhmmeter Type DO7 PLUS
25
Summary of Contents for DO7 PLUS
Page 60: ...551A550 Rev 3 ...

