nVision
Operation Manual
•
Page 13
Graphical.Screens.(Live.Recording,.or.Last.Recorded.Data)
The nVision graphical screens allow you to view
live recording
or
last recorded
data utilizing
the advanced viewing capabilities of the nVision display.
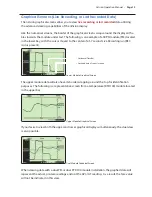
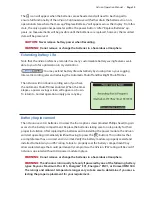
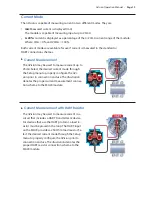
Like the numerical screens, the border of the graphical screens wraps around the display with a
bias towards the module under test. The following is an example of a 3KPSI module (PM) located
in the lower bay, with the cursor moved to the center of a 57 second Live Recording run (REC
icon is present).
Lower Module Graphical Screen
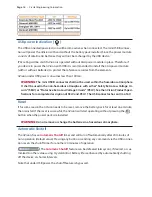
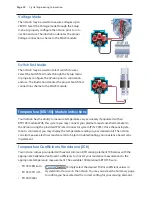
The upper module data will also have its border wrapping around the top for identification
purposes.
The following is a representative screen from a temperature (RTD100) module located
in the upper bay.
Upper Module Graphical Screen
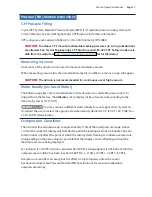
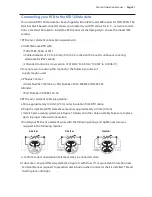
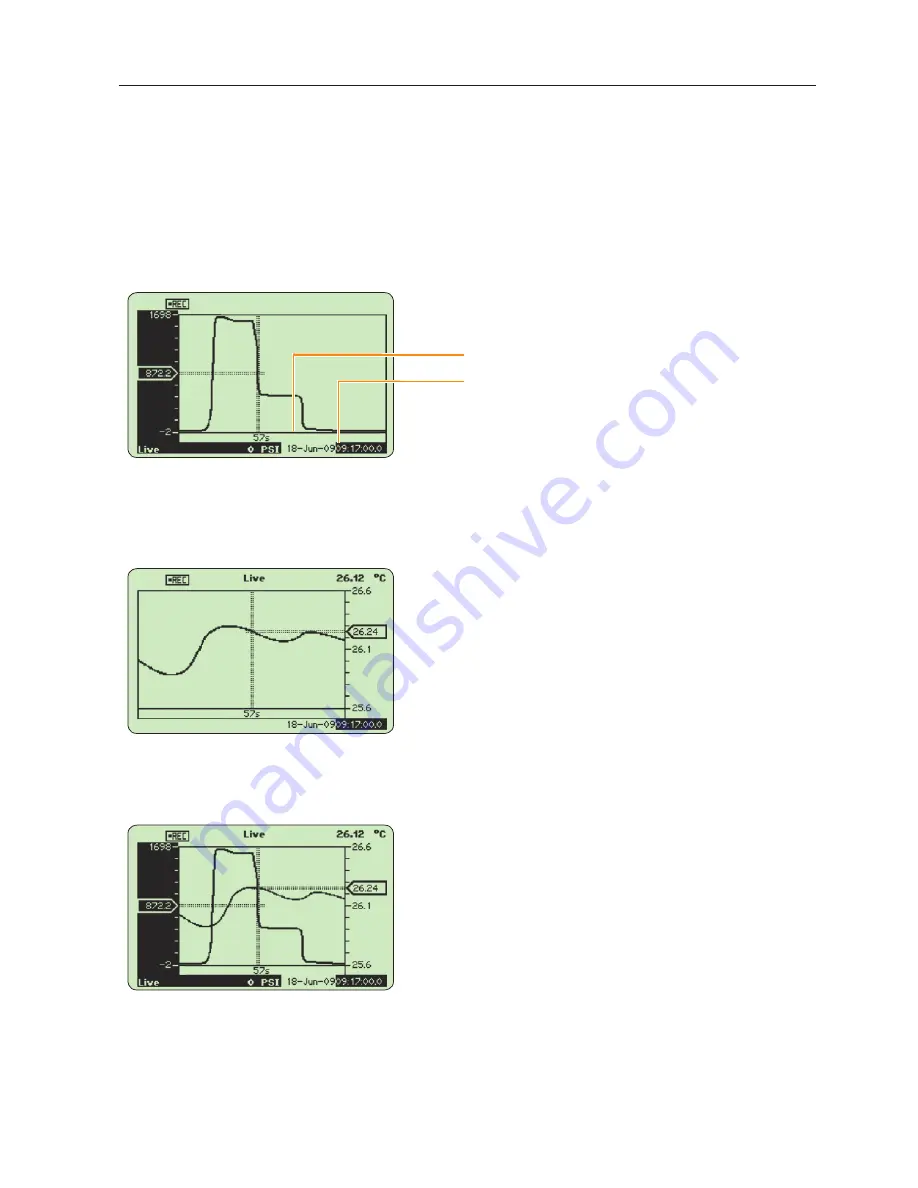
If you desire to view both the upper and lower graphical displays simultaneously, the dual view
is also possible.
Dual Module Graphical Screen
When viewing data with a dual PM or dual RTD100 module installation, the graphed data will
represent the actual, pre-tare readings and not the ∆P or ∆T reading. As a result, the Tare value
will not be indicated in this view.
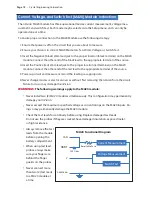
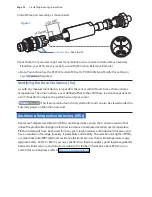
Horizontal Time Bar
Date and time of cursor location
Summary of Contents for nVision Lab Reference Recorder
Page 1: ...C R Y S T A L engineering corporation Operation Manual Reference Recorder Lab Reference ...
Page 6: ......
Page 67: ......


