29
ABPM with custo screen 300 and custo diagnostic | GEB 0154 – DK 1055 | Version 002 – 05.06.2013 | custo med GmbH
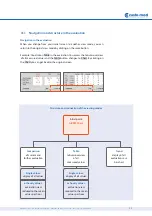
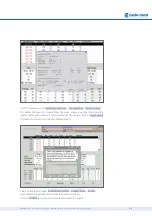
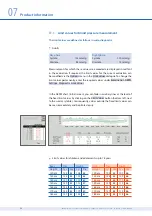
Initial point:
ABPM Chart
Comparison
of current and
further evaluation
Table
tabular overview
of all
measured values
Trend
display of all
evaluations as a
bar chart
06.3
Navigation and structure in the evaluation
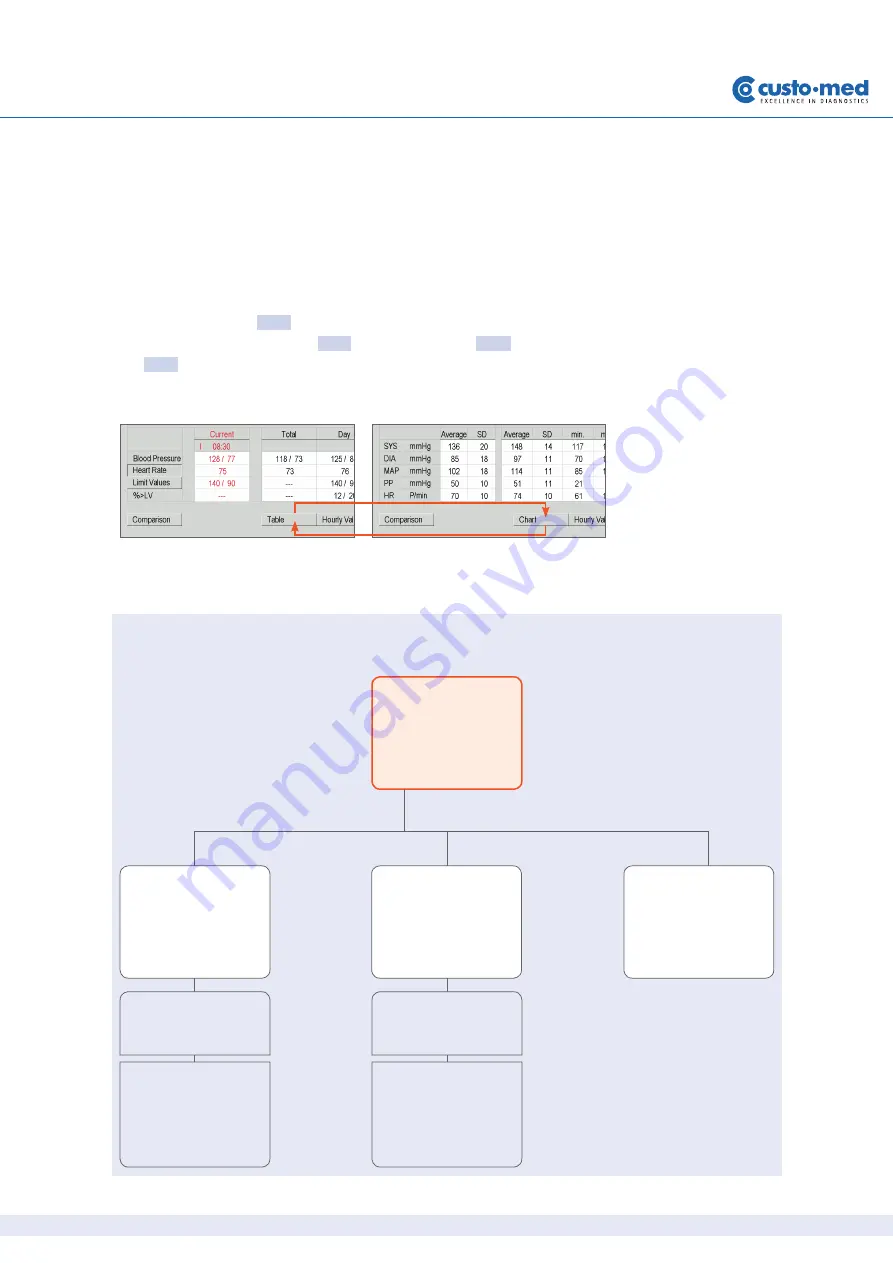
Navigation in the evaluation
When you change from your initial screen to another view mode, you can
return to the original view mode by clicking on the same button.
Example: You click on Table in the evaluation. You access the tabular overview
of all measured values and the Table button changes to Chart. By clicking on
the Chart you can get back to the original screen.
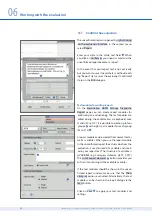
Structure and connection of the viewing modes
Single values:
display of all values
or hourly values:
evaluation view
reduced to the mean
values per hour
Single values:
display of all values
or hourly values:
evaluation view
reduced to the mean
values per hour
Summary of Contents for custo screen 300
Page 2: ......

