


8.Features
© 2023 China Daheng Group, Inc. Beijing Image Vision Technology Branch 152
As shown in the Figure 8-21, the 4-11, 3-10, … , 0-7 represents the data bits which is selected, and 4-11
is the high 8 bits of 12 bits data. The curvature of the curve increases by a multiple of 2, and the brightness
of the image increases with a multiple of 2, at the same time the noise increases.
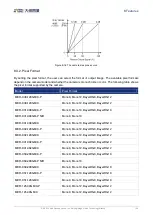
Non-linear lookup table such as gamma, contrast, brightness, etc., the lookup table tool can produce this
type of lookup table. The user can also create a lookup table by dragging the curve according to his own
requirements. Figure 8-22 is an example of a non-linear curve.
Figure 8-22 Non-linear lookup table
8.3.7.
Test Pattern
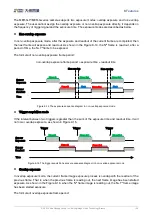
The MER-G-P/MER-G series camera supports three test images: gray gradient test image, moving
horizontal gray gradient test image, and moving diagonal gray gradient test image. When the camera
captures in Raw12 mode, the gray value of test image is: the pixel gray value in Raw8 mode multiplies by
16, as the output of pixel gray value in Raw12 mode.
The following three test images are illustrated in the RAW8 mode.
GrayFrameRampMoving
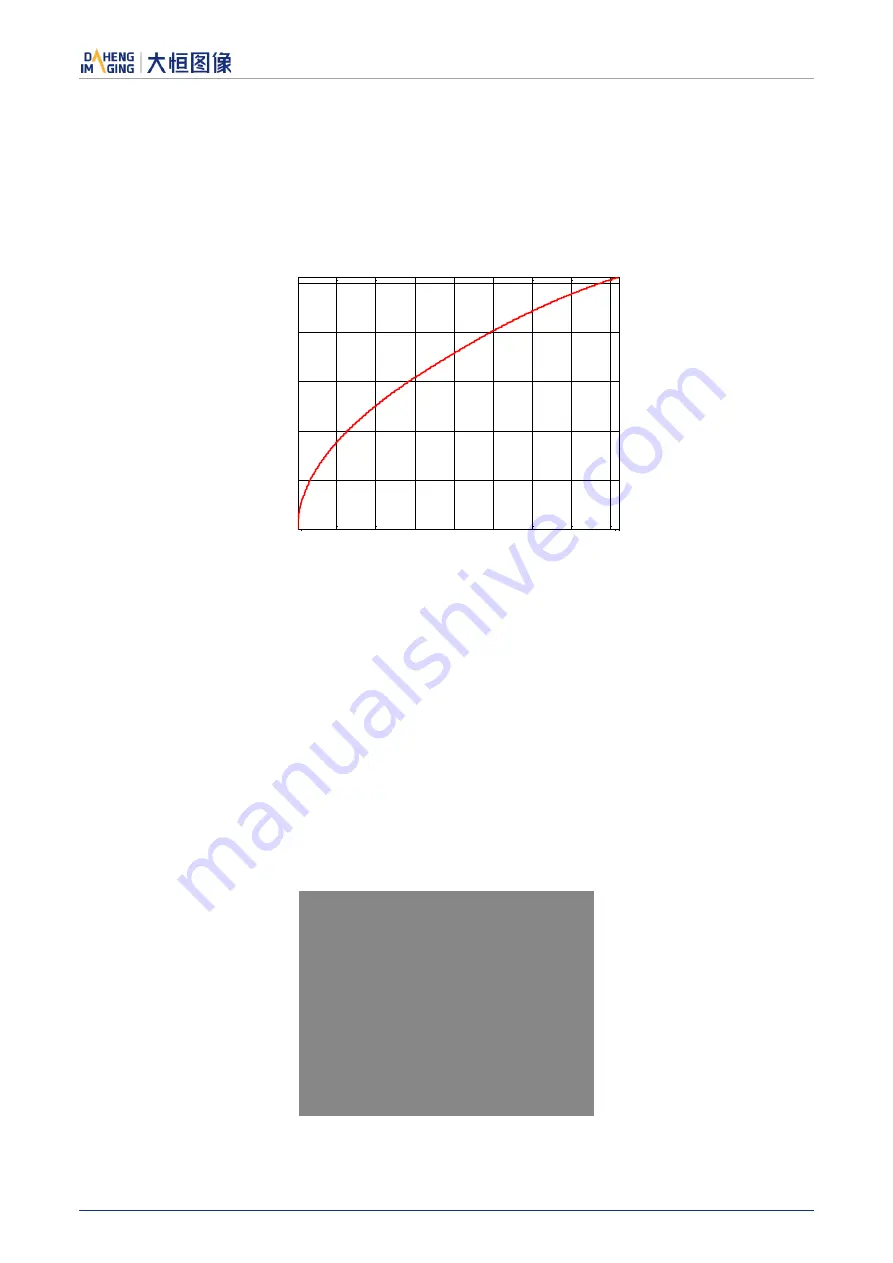
In the gray gradient test image, all the pixels' gray values are the same in the frame. In the adjacent frame,
the gray value of the next frame increases by 1 compared to the previous frame, until to 255, and then the
next frame gray value returns to 0, and so on. A printscreen of a single frame is shown in Figure 8-23:
Figure 8-23 Gray gradient test image
0
500
1000
1500
2000
2500
3000
3500
4000
0
50
100
150
200
250


