3-58
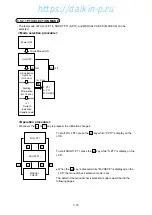
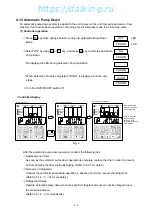
< Operation procedure >
CHART
INDICATION
MODE
CURRENT
INDICATION
MODE
Operation state
display
0/
CHART
0/
CHART
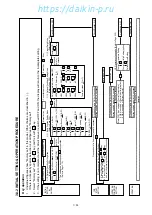
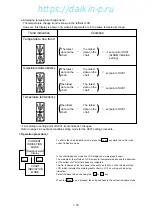
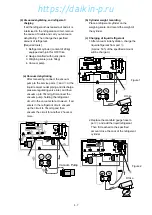
To shift to the chart indication mode, press the
key while the unit is in the
current indication mode.
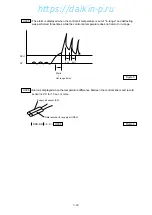
In the chart indication mode, the LCD displays a simple graphic chart.
The ordinate at the left side of LCD screen for temperature base and the abscissa
at the bottom of LCD for time base are indicated.
The No. indicated at the time base is the same as the No. on the left most of the
LCD, which indicates the simple graphic chart is of 12 hours log or 6 days log
indication.
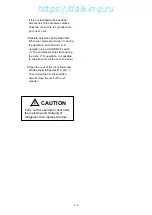
Select the base to be uses using the
or
key.
When the
key is pressed, the unit goes back to the current indication mode.
0/
CHART
0/
CHART
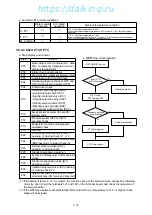
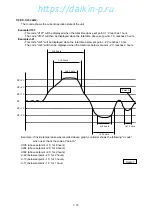
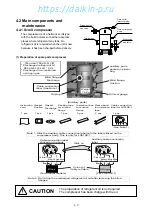
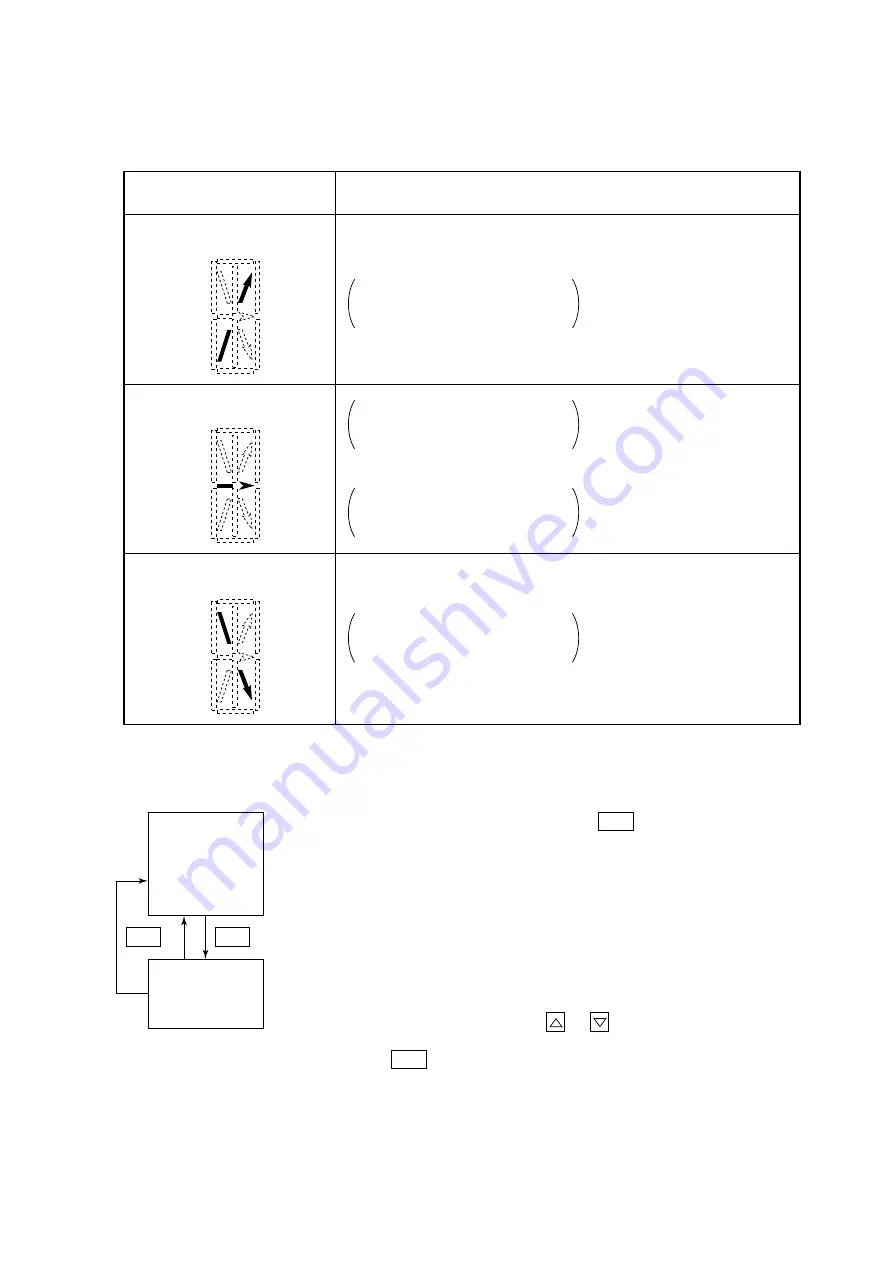
Temperature rise trend
Temperature stable tendency
Temperature fall tendency
Trend indication
Condition
The latest
data on the
chart
the oldest
data on the
chart
※
set point of H001
(ALARM indication
setting)
set point of H001
set point of H001
set point of H001
>
–
The latest
data on the
chart
the oldest
data on the
chart
<
–
the oldest
data on the
chart
The latest
data on the
chart
<
–
the oldest
data on the
chart
The latest
data on the
chart
>
–
or
●
Displaying temperature change trend:
The temperature change trend is shown in the leftmost LCD.
However, this display is shown only when all segments are in the same temperature range.
※
According to setting point of H001, trend indication changes.
Refer to page 3-32 optional condition setting mode for the H001 setting procedure.
https://daikin-p.ru

