OPERATION
MAGNITUDE WMT CHILLER
DAIKIN APPLIED
40
Demand Limit
The maximum amp draw of the compressor(s) can be limited
by a 4 to 20 mA signal on the Demand Limit analog input. This
function is only enabled if the Demand Limit Enable setpoint is
set to ON. The amp limit decreases linearly from the 100% Limit
(at 4 mA) to the Minimum Amp Limit setpoint (at 20 mA). While
this override is in effect, chiller capacity is continuously adjusted
to keep the % RLA near the requested demand limit.
Network Limit
The maximum amp draw of the compressor(s) can be limited by
a value sent through a BAS network connection and stored in
the Network Limit variable. While this override is in effect, chiller
capacity is continuously adjusted to keep the % RLA near the
requested demand limit.
Maximum Amp Limit
The maximum amp draw of the compressor(s) is always limited
by the Maximum Amps setpoint. This limit has priority over all
other functions including manual capacity control. While this
override is in effect, chiller capacity is continuously adjusted to
keep the % RLA near the limit value.
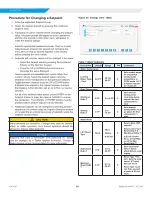
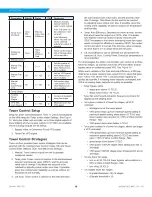
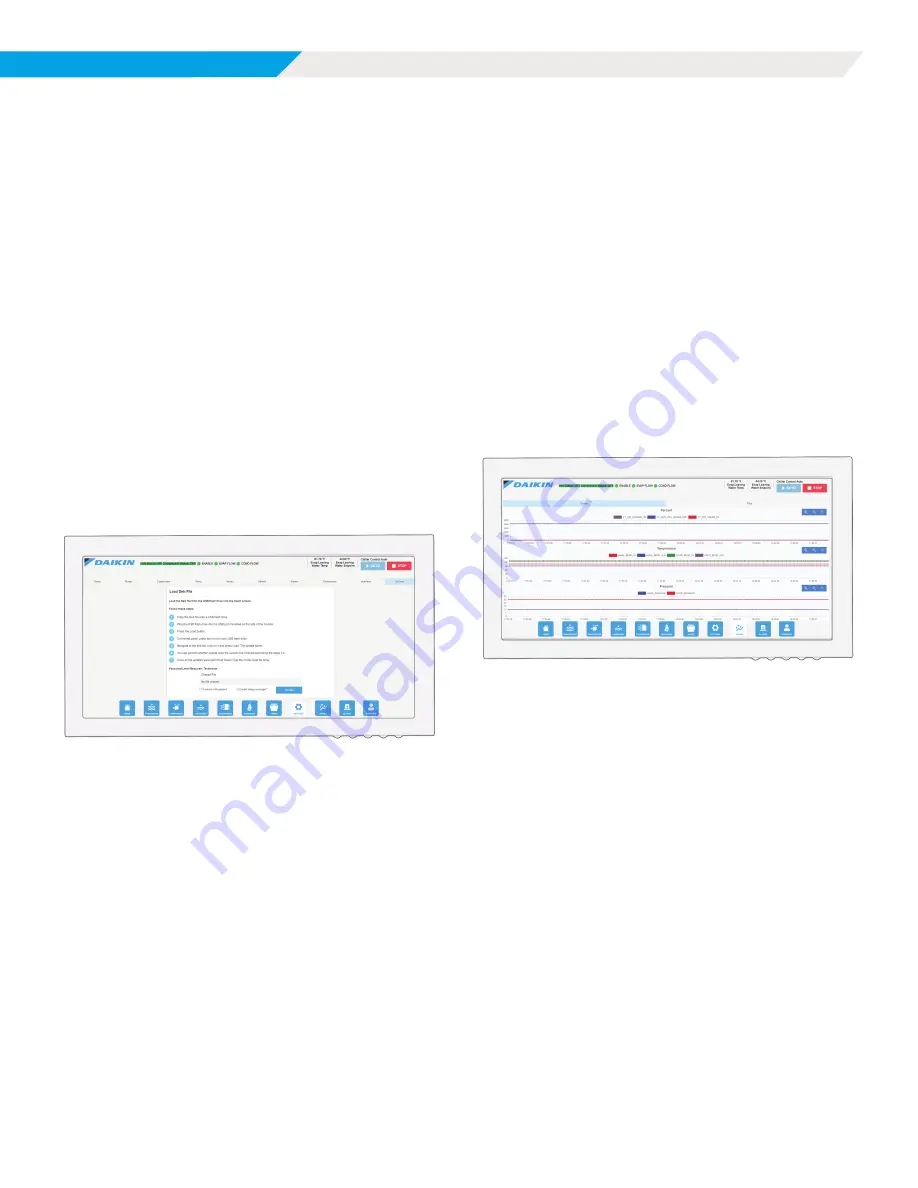
Figure 45: Settings View - Updater
Trend History Screen
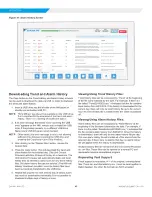
The Trend History Screen is accessed by clicking the TREND
button at the bottom of any screen. The Trend History Screen
allows the user to view the various parameters listed on the right
side of the screen.
The Trend History Screen can display history for
24-hour, 4-hour, 1-hour, or 20-minute periods by pressing the
appropriate button, respectively. For any time period, the trend
will display the current time beginning on the right of the screen
with history flowing to the left.
When the Unit Control Processor is powered on after being off,
the Trend History Screen will only display the history starting
from the time the Unit Control Processor was powered on.
Previous trend history can be downloaded but there will be a gap
in the data from when the Unit Control Processor was off. Trend
history is not affected if only the HMI screen (not the Unit Control
Processor) is off or in sleep mode.
Figure 46: Trend History Screen

