130
•
Troubleshooting
Z-Trak2 3D Profiler Sensors
Troubleshooting
Before contacting technical support
Review this Troubleshooting section. To aid Teledyne DALSA personnel when support is required,
the following should be included with the request for support.
•
From the
Start
menu, open the
Teledyne Dalsa Sapera LT
folder,
and run the
Sapera Log
Viewer
program. On the
File
menu, click
Save Messages
to generate a log text file.
•
Report the version of the Z-Trak2 driver and the version of Sapera LT used (must be version
8.61 or later).
Network setup and device IP issues
In rare cases, an installation may fail, or problems may occur in controlling and using the profiler.
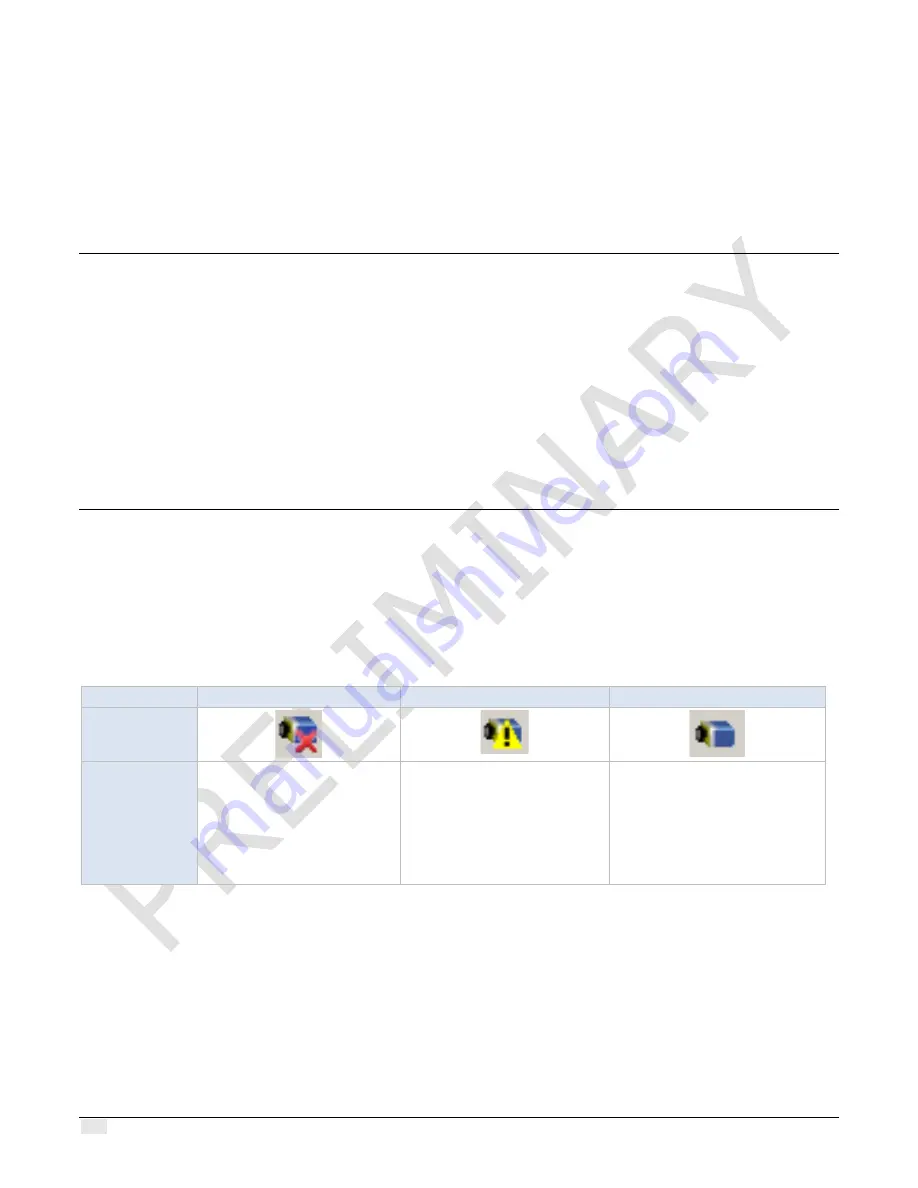
The Sapera GigE Server status icons found in the notification area (tray) provides visual
information on possible problems. The three states are shown in the following table. Note that even
an installation with no networking issue may still require optimization to perform to specification.
No Device Found
Device IP Error
Device Available
GigE Server
Tray Icon:
Note
—
It will
take a few
seconds for the
GigE Server to
refresh its state
after any
change.
A red X will remain over the
GigE Server tray icon when
the device is not found. This
indicates a network issue
where there is no
communication,
or in the
simplest case
,
the Z-Trak2 is
device not connected.
The GigE Server tray icon
shows a warning when a device
is connected but there is some
type of network or IP error.
This GigE Server tray icon
indicates that the device is
found. The Z-Trak2 device has
obtained an IP address and
there are no network issues.
Recall
—
10/100 Mb Ethernet is
not
supported by the Z-Trak2 series profilers. The Status LED will
show that it acquired an IP address (solid blue) but the device will not function at these slower
connections.

