Simplify Dashboard
Introduction
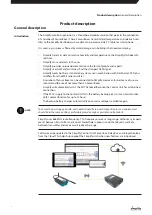
Fig . 1
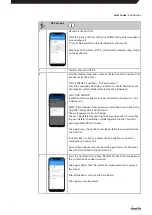
Data will be visible in the Dashboard when the Control Unit has uploaded data that is received
from Sensor Boxes .
•
The first data is received after a couple of minutes . All Sensor Boxes transmit 10 data points
in the first 10 minutes, subsequent transmissions are performed at the interval selected in
the Dashboard .
•
Once the data from the Sensor Boxes has been read by a Control Unit, the boxes go into
sleep mode . The Relay Box and Integration Box do not go into sleep mode, but report at the
selected data interval .
•
Sensor Boxes transmit signals to the Control Unit at the interval defined in the Dashboard .
•
Battery life depends on the transmission interval and on-site radio conditions . The residual
voltage of the battery of the Sensor Box is displayed in the Dashboard for each Sensor Box .
•
The Sensor Box default transmission interval of 1 hour typically ensures a battery life of +5
years .
•
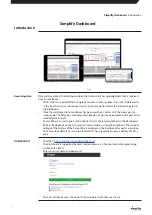
The URL is
https://dantherm .cloudDashboard .net
•
The Dashboard is supported by most modern browsers (Chrome, Internet Explorer, Edge,
Firefox, Safari (MAC) .
•
Enter your user name and password .
•
The user will have access to Control Units associated with that user name .
Receiving data
DASHBOARD
Simplify Dashboard
: Introduction
16


