4-7
4.7 TEST RESULTS
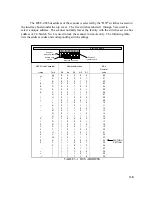
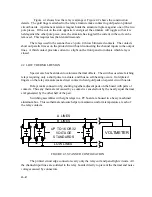
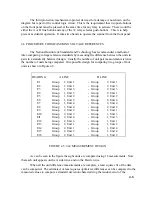
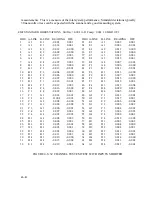
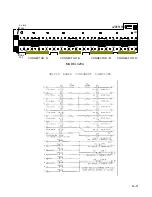
Figure 4.6 shows the results of an actual test run on a typical Model 320A Scanner. It
is a run of 64 measurements simulating eight sets of four standard units. For this test each of
the 32 inputs was shorted individually with a short length of copper wire. Thus the printout
shows the total errors in the measuring system.
For this run each channel was shorted together between the high and low input. The
test results show residual thermal emfs and noise for the scanner and the measuring system
used.
The measuring system consists of a Keithley 181 Nanovoltmeter connected to the
Scanner A and B high (red) output lines with the A and B low (black) output lines shorted
together. The Data Proof Voltage Reference Maintenance Program (VoltRef) was run on a
computer to control the instruments to make the measurements.
VoltRef closes the two relays, waits 20 seconds and then takes 10 readings. It then
reverses the relays, waits another 20 seconds and takes 10 more readings. The average of the
20 readings is the printed value. When all the readings are obtained, VoltRef computes a least
squares fit of the data using the NIST procedure.
As can be seen from the print out, the standard deviation for the entire measurement
was less than 10 nanovolts and the thermally generated emfs for all channels were less than 25
nanovolts.
Summary of Contents for 160A
Page 8: ...1 4 Blank Page ...
Page 10: ...2 2 Blank Page ...
Page 26: ...4 8 Blank Page ...
Page 30: ...5 4 ...
Page 41: ...6 11 ...
Page 43: ...6 13 ...
Page 47: ...6 17 ...

