Chapter 10
Ethernet Traffic Analysis
Page 10-3
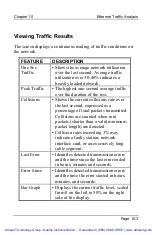
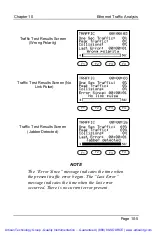
Viewing Traffic Results
The screen displays a continuous reading of traffic conditions on
the network.
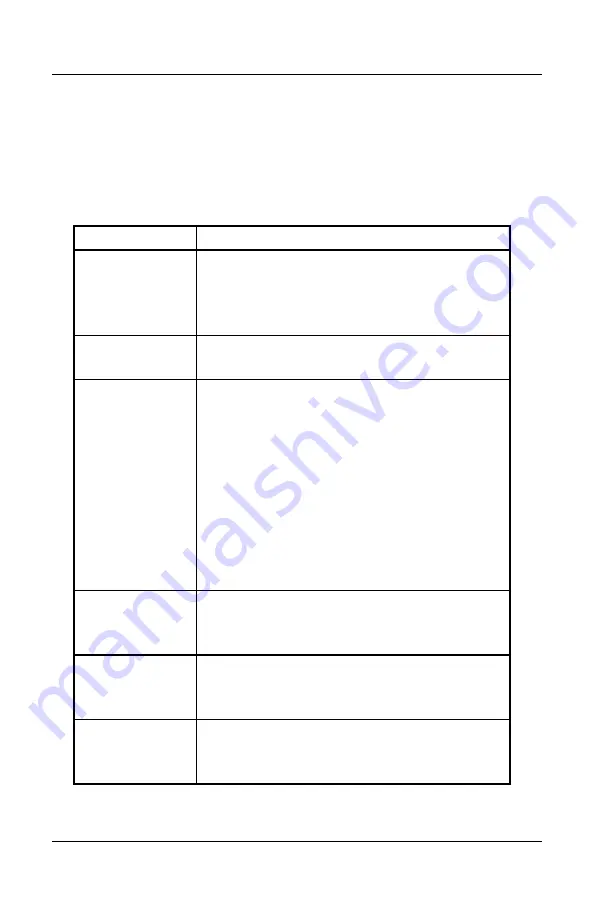
FEATURE
DESCRIPTION
One Sec
Traffic
• Shows the average network utilization
over the last second. Average traffic
utilization over 30-40% indicates a
heavily loaded network.
Peak Traffic
• The highest one-second average traffic
over the duration of the test.
Collisions
• Shows the current collisions rate over
the last second, expressed as a
percentage of total packets transmitted.
Collisions are counted when runt
packets (shorter than a valid minimum
packet length) are detected.
• Collision rates exceeding 3% may
indicate a faulty station, network
interface card, or an excessively long
cable segment.
Last Error
• Identifies detected transmission errors
and the time since the last error ended
in hours, minutes and seconds.
Error Since
• Identifies detected transmission errors
and the time the error started in hours,
minutes, and seconds.
Bar Graph
• Displays the current traffic level, scaled
from 0 on the left to 50% on the right
side of the display.
Artisan Technology Group - Quality Instrumentation ... Guaranteed | (888) 88-SOURCE | www.artisantg.com

