USE AND OPERATION
65
4
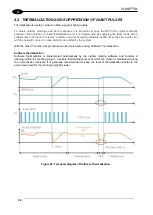
As you can see in the graph shown in the Figure, during the marking phase the Q-Switch Modulation signal
determines the frequency with which the laser pulses are generated, the effect of the LEVEL signal is a
corresponding change in the laser diode current.
Please note that, in order for this to occur, the EMISSION signal has to be active.
NOTE:
Please also note that the current supplied to the laser diode is intentionally forced to have rising and
falling times in the range of 150us. This protection from rapid commutations (generated by faster
changes of LEVEL or EMISSION signal fronts) is intended to reduce the risk of damage risk and
extend lifetime of the diode itself.
During the thermalization phase, the EMISSION signal stays active, while the LEVEL signal goes into a pre-
set thermalization level (i.e. 90%) and the Q SW MOD signal stays fixed at 0 V.
At the end of the thermalization phase, before starting another marking phase, the FPK (First Pulse Killing)
procedure needs to be implemented in order to discharge the crystal, thus avoiding the generation of “giant”
pulses which may cause marking defects as well as damages to the internal optics of the resonator.
To discharge the crystal, the Q-Switch is kept closed (Q SW MOD signal at 0 V) and the EMISSION signal is
brought to a 0V level for at least 450 microseconds, so as to cut off the current in the laser diode and
consequently the pumping of the crystal (FPK delay).
Laser source
Frequency
interval
Operation in
Continuous
Wave (CW)
Q-switch opening
time (Shot Time)
Optimal FPK delay
Vlase
TM
IR 10 W
10 kHz to 200 kHz
YES
1,5 µs
450µs
Vlase
TM
IR 20 W
20 kHz to 200 kHz
YES
1,5 µs
450µs
WARNING!
It is strongly recommended
NOT
to change the set FPK Shot time and delay, because they have
been optimized to ensure the safety of the marking system and the performance marking linked to
the high stability of the laser pulses.
Summary of Contents for VLASE IR 1PWX-TLS2
Page 1: ...USER S MANUAL VLASETM IR ...
Page 34: ...VLASETM IR 34 2 2 6 CONNECTION EXAMPLES Figure 27 Connection examples ...
Page 85: ...85 EXTERNAL LABEL PLACING Figure 67 Positioning of external labels rack ...
Page 86: ...86 Figure 68 Positioning of external labels resonator ...
Page 90: ...90 BLOCK DIAGRAM VLASETM SAFETY LOGIC DETAILS FOR AUTOMATIC PRODUCTION LINE ...
Page 108: ...108 APPENDIX G MECHANICAL DRAWINGS ...
Page 109: ...109 NOTE Please refer to Datalogic website for detailed drawings ...
Page 112: ......


