UM-0085-B09
DT80 Range User Manual
Page 145
RG
dEX Web Interface
Using the Web Interface
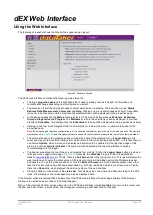
The following screenshot shows the Monitor the Logger screen layout:
Figure 49: Welcome Screen
The
DT80
web interface comprises the following main elements:
•
The large
properties pane
on the right hand side is used to display various "screens" of information. Its
contents will change depending on which screen you select.
•
The menus on the left hand side are used to select which screen to display. There are five menus:
Status
,
Retrieve Data
,
Measurement
,
Command
, and
Help
. Clicking on a menu button causes its list of menu items
(screens) to be revealed, and the most recently selected screen will be displayed in the properties pane.
•
In the above screenshot, the
Status
menu is selected. This menu has five screens:
Welcome
,
Schedules
,
Storage
,
Diagnostics
and
Program
. The
Welcome
screen is the one that is currently displayed. If you then
clicked on
Schedules
, for example, then the
Schedules
screen would be displayed in the properties pane area.
•
Clicking on the four small triangles at the far left will hide (or restore) the menu, to allow more space for the
properties pane.
Note:
By using the web interface configuration tool, it is possible to disable or restrict some of the menu options. The sample
displays shown in
and throughout this section assume that all options are available (which is the factory default).
•
The purple strip above the properties pane contains the name of the selected menu (
Logger Status
in this
case) and may contain controls (buttons etc.) which relate to the currently displayed screen. In this case there is
one button:
Update
, which will cause the displayed information to be updated. At the right hand edge of this
area is the circular
activity indicator
. This symbol will be animated while the web interface is actively
communicating with the logger.
•
The banner area along the top of the screen contains four controls: Firstly, the
Logger home
button provides a
link back to the Logger Home page
. Secondly, the
dataTaker
logo is a link to the dataTaker
website (
). Thirdly, there is a
Full Screen
link in the top right corner. This link will display the
web interface so it covers the entire screen. All browser controls will be hidden, as will the Windows task bar
and desktop. To exit this mode press Esc or click the
Exit Full Screen
link. Note that all keyboard input, other
than the Esc key (and certain Windows keystrokes e.g. Alt-Tab), is disabled while in full screen mode. Finally,
there is an
About
link, which displays the version number of the web interface.
•
Along the bottom of the screen is the
status bar
. This displays the current time and date according to the PC's
clock. Other status or error messages may also be displayed here.
If the browser window is resized then all elements of the
DT80
web interface will resize appropriately. If the browser
window is too small, however, then scroll bars will appear.
Many of the controls and other screen elements in the
DT80
web interface include
tool tips
. If you move the cursor over
the item and hold it there, a small yellow box will appear containing a brief description of the item.


