UM-0085-B09
DT80 Range User Manual
Page 146
RG
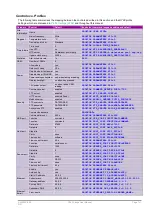
Status Screens
The
Status
menu allows you to select one of five different screens, each showing useful information about the current
status of the
DT80
.
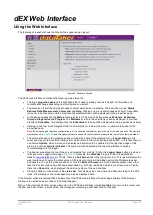
Welcome Screen
The
Welcome
screen, as shown in
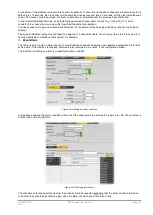
is the first screen displayed when the web interface is started. It includes
the following basic information about the connected logger:
•
name of the currently loaded job, if any
•
current date and time, according to the
DT80
's real-time clock. Press
Update
to update the display.
•
the logger product type, including model number and series (e.g.
DT80-2
for a DT80 Series 2)
•
the logger serial number
•
the version number of the logger's firmware
Schedules Screen
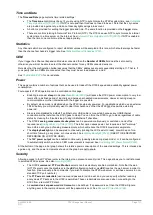
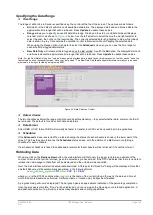
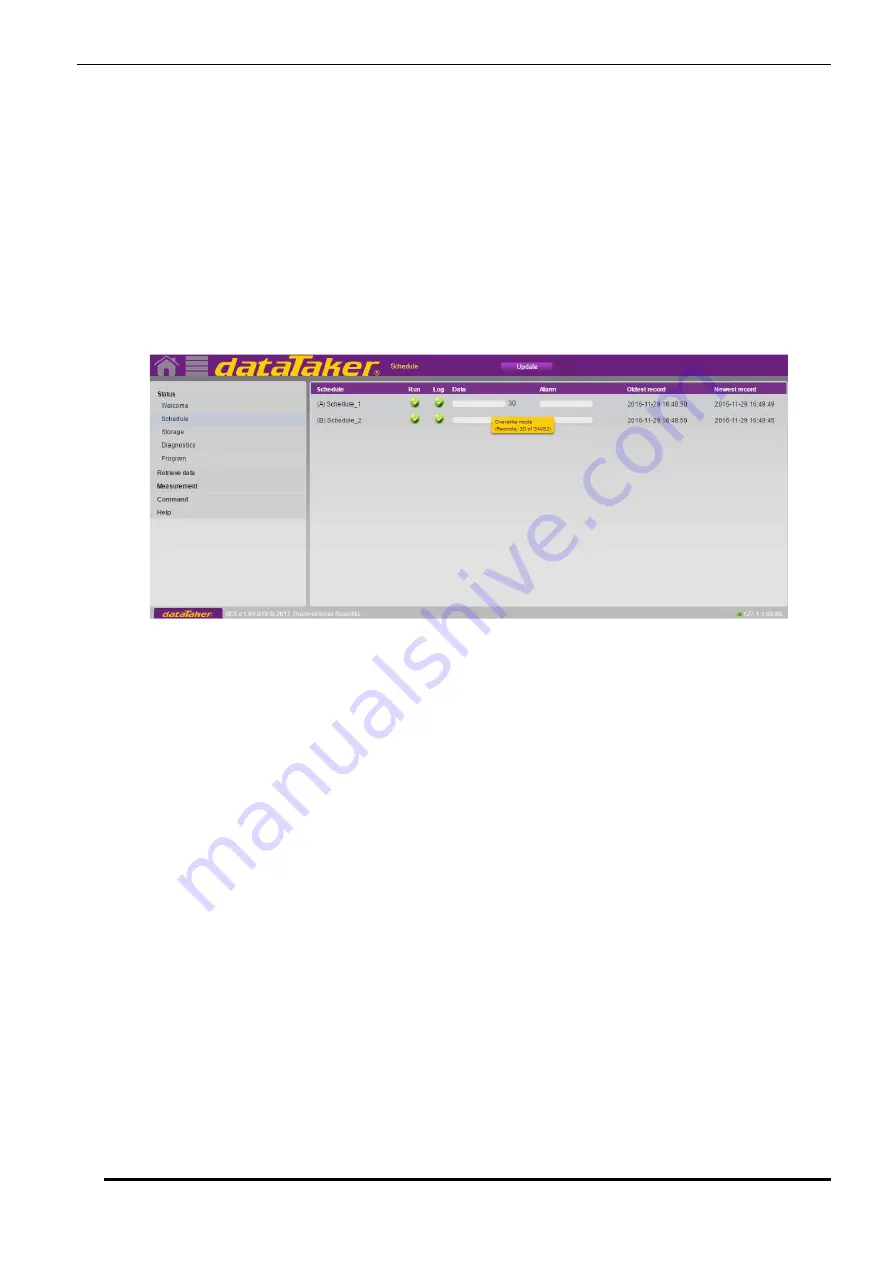
Figure 38: Schedule screen
The
Schedules
screen shows the status of each of the schedules in the current job.
The schedules are presented in tabular form, one row per defined schedule. For each schedule the following information
is displayed:
•
schedule ID (e.g.
A
) and user-defined name, if any
•
whether the schedule is running or halted (in the above example all six schedules are running)
•
whether logging is enabled for the schedule (in this case logging is enabled for all schedules except schedule E)
•
the number of logged data and alarm records. The bar graphs give an indication of the percentage of the
allocated storefile space that contains data. For schedules operating in overwrite mode (which is the default),
the bar graph is shown in blue. For schedules in non-overwrite mode (e.g.
RA(DATA:5H:NOV)1S
), the
bargraph is shown in red if the storefile is greater than 80% full, otherwise green.
•
the timestamp of the oldest logged record (data or alarm)
•
the timestamp of the newest logged record (data or alarm)
Press
Update
to update the displayed details.
Click on a column heading to re-sort the table based on the data in that column. The small triangle shows which column
is the current sort key.
Note:
the yellow tool tip in the above screen shot, which pops up if you move the mouse cursor over the bar graphs. This shows the
storefile mode (overwrite/non-overwrite), the number of logged records and the size in records of the store.
Storage Screen
The
Storage
screen provides an overview of the amount of space used and available on the
DT80
's internal file system,
or on a connected USB memory device.
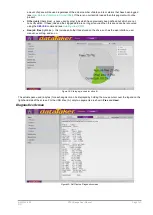
Select the drive to display (B: drive – internal, or A: drive – USB device) using the control at the top of the screen.
The displayed pie chart contains up to four segments:
•
Free
(green) – this space is unused
•
Current job
(orange) – space used by current job, including program text storage, data and alarm files, and any
saved archive files. Remember that the data and alarm storefiles are pre-allocated, fixed size files, so the same

