48
Getting Started with DT800
dataTaker
UM-0071-A0
7-2
C
HART
THE
R
ETURNED
D
ATA
➲
Display data from the potentiometer channel
in DeLogger’s chart window.
To do this…
a) Locate the minimized chart window at the bottom of
DeLogger’s main window — it’s named
Chart1.dlc
— and click its Restore button.
The chart window is restored from its minimized
state.
b) Make sure that the chart window is in Edit Mode.
c) In the Chart menu (seventh menu from the left),
choose
Select Channels…
.
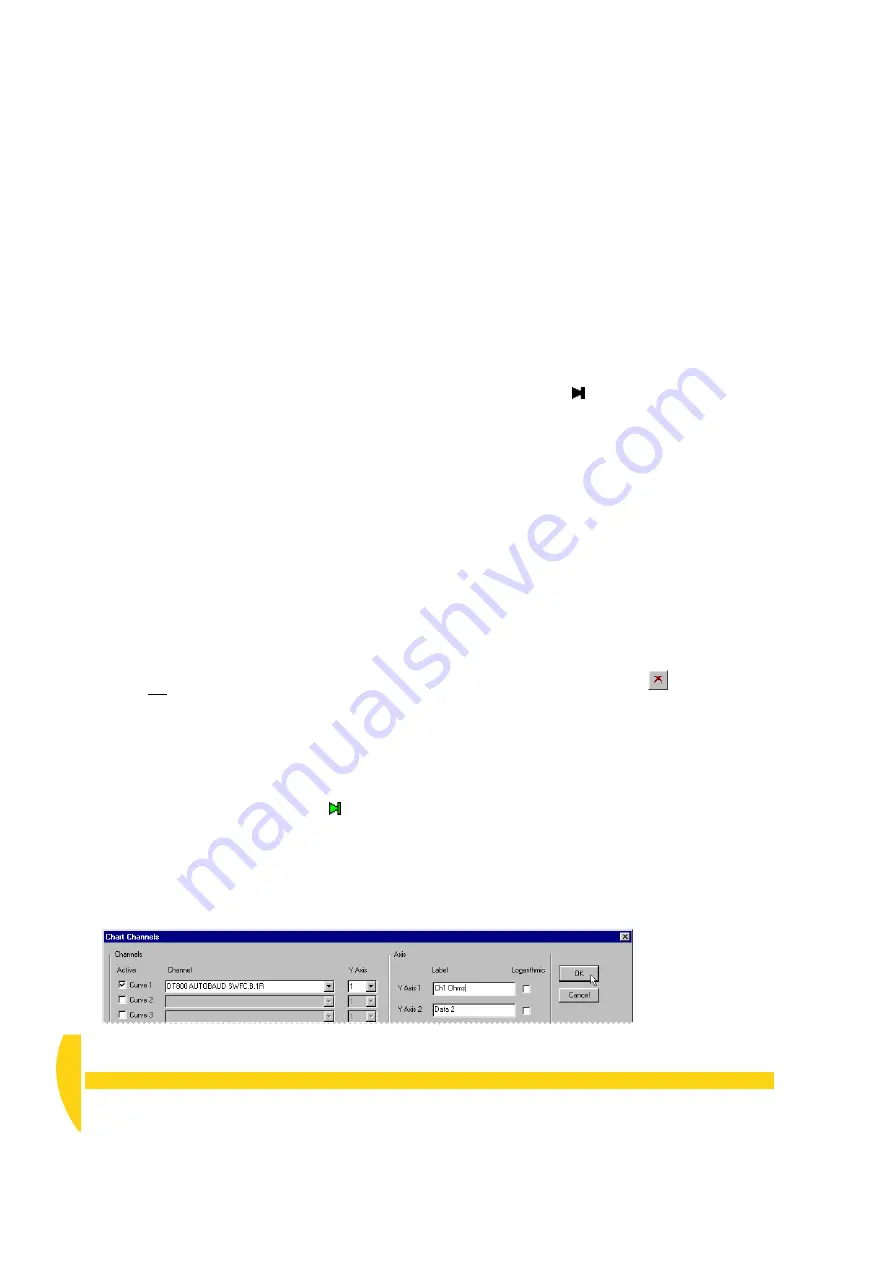
The Chart Channels dialog box opens (Figure 48).
d) In the Chart Channels dialog box:
i. Under
Active
, tick
Curve 1
.
ii. Open the
Channel
drop-down list box that
becomes available and choose the
potentiometer channel.
iii. Leave the
Y Axis
set to
1
.
iv. Under
Label
, replace
Data 1
in the
Y Axis 1
field with
Ch1 Ohms
(or any text you want to
appear on the vertical/data axis of the chart).
v. Do not tick under
Logarithmic
.
vi. Click
OK
.
The dialog box closes leaving the chart window
almost ready to receive channel 1’s data.
Note the axis text
Ch1 Ohms
on the left-hand side of
the chart window.
e) Make sure that the
Play Chart
button ( at the right-
hand end of horizontal axis) is pressed/green.
f) Turn Edit Mode
off
(un-tick
Edit Mode
on the Chart
menu, or click the
Edit Mode
button on the bottom of
the chart window) and watch the chart window
while you turn the potentiometer’s knob.
The data points are plotted in the trend area and
joined with straight-line segments as the chart moves
from right to left.
g) In the Chart menu, choose
Auto Re-scale
.
All the data returned to the chart window so far is
compressed into view in the trend area.
h) Click the
Play Chart
button to stop the chart (the
button turns black ).
Note that stopping the chart does not stop the flow
of data into the window, whereas the
Pause
command does stop the flow — no data is stored in
the window’s buffer when the window is paused.
This is also true for the other windows that can be
paused (form, mimic and text).
i) Use your mouse as described in Figures 45 and 46
to scale and shift the trace.
j) Drag the time and data rulers into the trend area as
shown in Figure 47.
Notice the information box that appears for each
ruler. You can drag the box to your preferred
position in the DeLogger window.
k) Turn Edit Mode
on
then choose
Clear
from the Chart
menu (or click the
Clear
button
).
All the data returned to the chart window is deleted.
l) Continue to experiment in the chart window if you
want. Remember that Edit Mode must be
off
to plot
incoming data.
F
IGURE
48
Assigning a channel to the chart window
Summary of Contents for DT800
Page 1: ...UM 0071 A0 ...
Page 2: ...UM 0071 A0 ...
Page 73: ...UM 0071 A0 ...
Page 74: ...UM 0071 A0 ...


