C
HAPTER
7 S
EE
Y
OUR
D
ATA
— C
HART
W
INDOW
: DeLogger’s Chart Window
43
UM-0071-A0
CHAPTER 7
S
EE
Y
OUR
D
ATA
—
C
HART
W
INDOW
DeLogger’s chart window turns your computer into a
powerful chart recorder.
In this chapter
• you’re introduced to DeLogger’s chart window —
• you chart data being returned from the DT800 —
7-1
D
E
L
OGGER
’
S
C
HART
W
INDOW
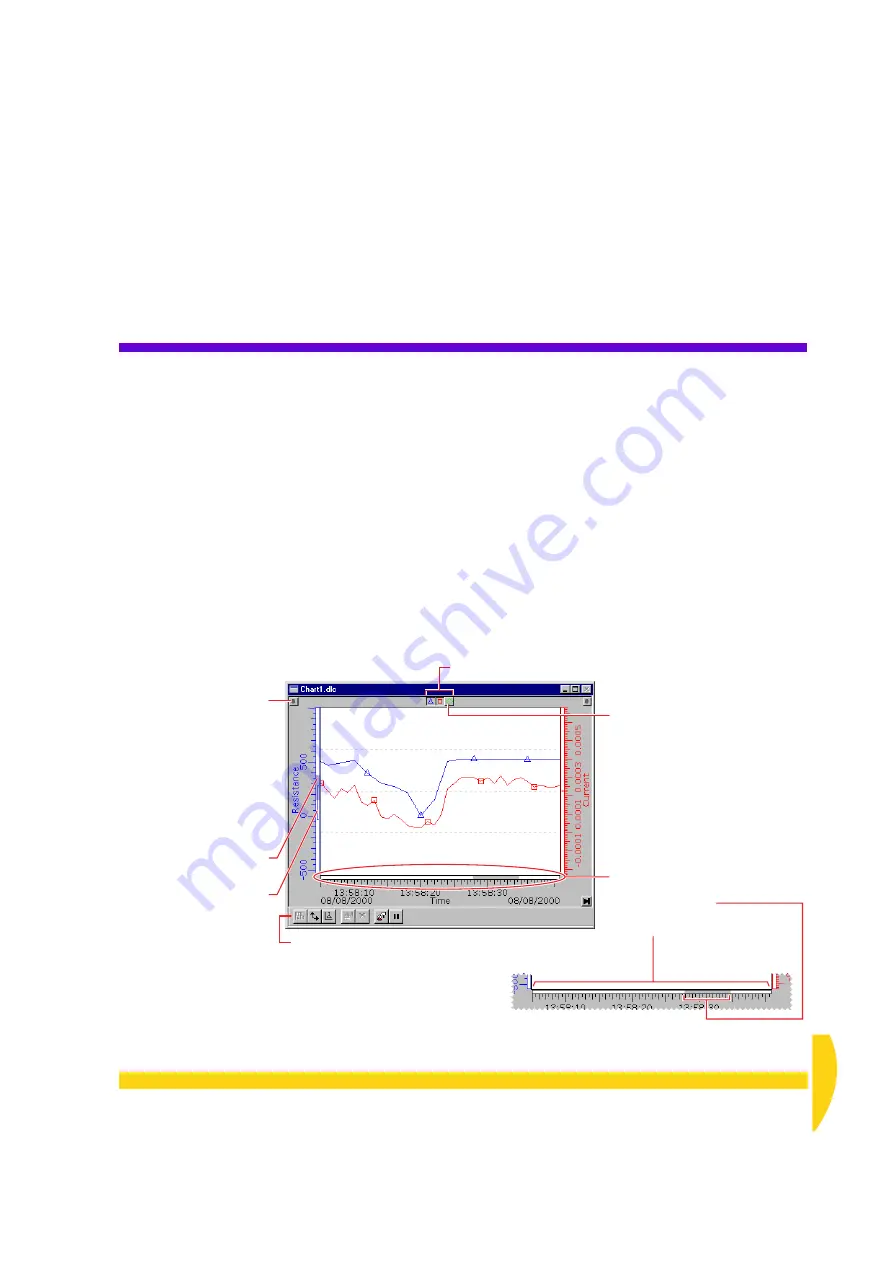
A DeLogger
chart
window displays how the value of
one or more DT800 channels changes with time. See
Figures 43 and 44.
Incoming data from user-selected real-time or replay
channels is automatically plotted against time. New
data is plotted on the right-hand side of the trend area
and the trend graphs move from right to left, exactly
like the traces on a chart recorder.
You can display data from up to twelve channels in
each chart window — that is, twelve separate trend
graphs per chart window — and you can assign the
Chart toolbar
The buttons duplicate commands
found on the Chart menu.
See
Drag it from its docked position
to create a floating toolbar.
Drag a scale’s
handle
to
relocate the scale.
You can, for example, drag
a scale to the other side of
the trend area, or place one
above another (separates
the trends).
See
Individual graph
show/hide
buttons
The
horizontal overview bar
shows the currently-visible section of
data (the gray bar)
in proportion to the entire data set
(the full width of the trend area).
The
vertical overview bar
shows the currently-visible
range (the gray bar)
and the
maximum-to-minimum range
of the data (the
I
bar)
in proportion to the
maximum displayable
vertical range of the chart
(the full height
of the trend area).
When you rest the mouse over a
graph’s
Show/hide
button, a pop-
up information bar appears.
See
F
IGURE
43
A DeLogger chart window displays trend graphs (like a char t recorder).
Summary of Contents for DT800
Page 1: ...UM 0071 A0 ...
Page 2: ...UM 0071 A0 ...
Page 73: ...UM 0071 A0 ...
Page 74: ...UM 0071 A0 ...


