28
9.
Monitoring, Management, and Troubleshooting
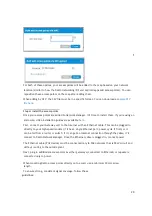
With your network running and customized, you can now monitor its usage and
status by selecting the Network Status link. Here’s an overview of the tools
available:
Network Usage graph at the top of the page shows the number of users on SSID#1
and the amount of upload and download traffic.
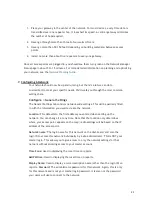
Node Map shows the nodes relationship to each other on a map.
Node List gives details on each individual node.
Node Outages Chart shows the check-in status of a node using colors.
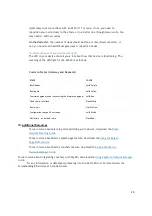
STATE COLOR
Cloud check-in succeeded
Solid Teal
IP acquired via DHCP, but inet test is failing
Flash Purple
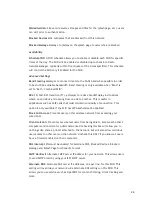
Users List shows all users connected to the network.
Network Diagram shows how all nodes relate
to each other.
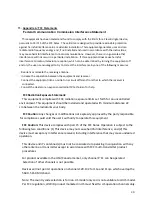
STATE COLOR
Checkin performed, mesh speed <= 2Mbps
Flash Green
Orphan mode
Flash (Yellow), then Green
Lonely mode
Flash (Red), then Green
checkin performed, mesh speed >2Mbps
Solid Green
You can use each of these tools to see how your network is doing and troubleshoot
issues.
Troubleshooting in
Datto Network Manager
Have you have created a strong, healthy network? While there are plenty of
diagnostic tools available, the following two are most telling:
On the Node Outages Chart: dark/light green indicate a gateway/repeater is online
and hasn't missed a check-in, yellow indicates a node has lost contact with the mesh
and is in lonely/orphan mode, pink is when a node needs re-pairing (update of
network settings), and gray indicates it's down, offline or has missed check-ins.
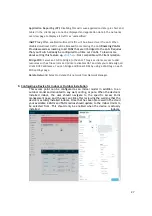
On the Node Map: (click on a node, then select Neighbors) all nodes will have at
least one

