U
S I N G
T H E
S
O F T W A R E
Using the Plot Window
73
U
S I N G
T H E
P
L O T
W
I N D O W
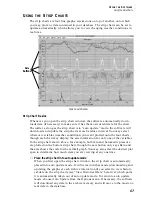
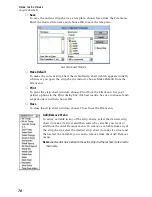
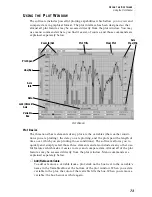
The software includes powerful plotting capabilities which allow you to view and
compare data in graphical format. The plot interface has been designed so that
almost all plot features may be accessed directly from the plot window. You may
use menu commands where you find it easier, of course, and those commands are
explained separately below.
P
LOT
W
INDOW
Plot Basics
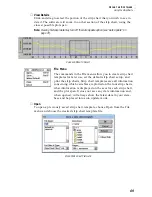
The three most basic elements of any plot are the variables (the weather condi-
tions you are plotting), the date you are plotting, and the plot span (the length of
time over which you are plotting those conditions). The software allows you to
quickly and simply select those three elements and also includes many other use-
ful features which make it easier to view and compare data. Almost all of the plot
features may be accessed directly from the plot window. Menu commands are
explained separately below.
▲
Add/Remove Variable
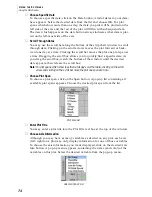
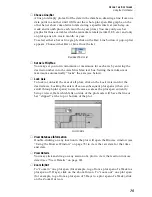
To add or remove a variable from a plot, click on the box next to the variable’s
name in the Variables Box at the bottom of the plot window. When you add a
variable to the plot, the color of that variable fills the box. When you remove a
variable, the box becomes white again.
Zoom In/Out
Plot Title
Clear Plot
Axis
Max/Min
Lock/Unlock
Axis
Plot Span
Line/Bar
Axis
Info
Date
Variable
Box
Summary of Contents for GroWeatherLink
Page 1: ...G R O W E A T H E R L I N K Software User s Guide For Windows 0 Version 1 2 0 Product 7871...
Page 3: ...G R O W E A T H E R L I N K Software User s Guide For Windows 0 Version 1 2...
Page 7: ...TABLE OF CONTENTS iv...
Page 9: ...INTRODUCTION Contents of Package 2...
Page 17: ...HARDWARE INSTALLATION Radio Multi Point Connection 10...
Page 107: ...TECHNICAL REFERENCE Importing WeatherLink Data into Other Programs 100...


