Health EnviroMonitor Overview
Page 10
Health EnviroMonitor Manual
Rainfall
The Health EM provides two separate registers for tracking rainfall totals. One
is referred to as “daily” rainfall and the other is referred to as “total” rainfall. In
truth, these registers can be used to record rainfall over any period of time you
desire. The “daily” register can be cleared daily using the AutoClear function
(see “AutoClear” on page 11) to provide true daily rainfall totals or you may
clear it manually every few days, after a storm, at the end of the month, etc.
The total rainfall amount must be cleared manually and how often you clear
the register determines what period of time its rainfall total reflects. The
Health EM also calculates the rate of rainfall using the amount of time between
each .01” or .2 mm rainfall increment.
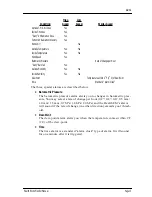
• “Daily” Rainfall (Alarm: High) (AutoClear)
• Current Rate of Rainfall
• Cumulative Total Rainfall
• “Daily” High Rate of Rainfall with time of occurrence
Inside and Outside Humidity and Dew-Point
Humidity refers to the amount of water vapor in the air. However, the amount
of water vapor which the air can contain changes with changes in air tempera-
ture and pressure. Relative humidity takes into account these factors and offers
a humidity reading which reflects the amount of water vapor in the air as a
percentage of the amount the air is capable of holding. Relative humidity,
therefore, is not actually a measure of the amount of water vapor in the air, but
a ratio of the air’s water vapor content to its capacity.
It is important to realize that relative humidity changes with temperature, pres-
sure, and water vapor content. A parcel of air with a capacity for 10 g of water
vapor which contains 4 g of water vapor will have a relative humidity of 40%.
Adding 2 g more water vapor (for a total of 6 g) would change the humidity to
60%. If that same parcel of air is them warmed so that it has a capacity for 20 g
of water vapor, the relative humidity drops to 30% even though water vapor
content does not change.
Dew-point is the temperature to which air must be cooled for saturation (100%
relative humidity) to occur, providing there is no change in water content. The
dew-point is an important measurement used to predict the formation of dew,
frost, and fog. If dew-point and temperature are close together in the late after-
noon when the air begins to turn colder, fog is likely during the night. Dew-
point is also a good indicator of the air’s actual water vapor content (as
opposed to relative humidity). High dew-point indicates high vapor content;
low dew-point indicates low vapor content. You can even use dew-point to
predict the minimum overnight temperature. Provided no new fronts are
expected overnight, the afternoon’s dew-point gives you an idea of what mini-
mum temperature to expect that night, since the air is not likely to get colder
than the dew-point anytime during the night.
• Relative Outside Humidity (Alarm: High/Low)
Summary of Contents for Health EnviroMonitor
Page 1: ...H E A L T H E N V I R O M O N I T O R CONSOLE USER S MANUAL Product 7470 7475...
Page 6: ...Health EnviroMonitor Manual Page 53...
Page 44: ...Using the Health EM Page 52 Health EnviroMonitor Manual...
Page 53: ...Health EnviroMonitor Overview Page 14 Health EnviroMonitor Manual...
Page 56: ...Introduction to the Health EnviroMonitor Page 4 Health EnviroMonitor Manual...
Page 59: ...Table of Contents Page iv...

