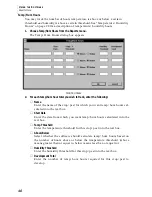
U
S I N G
T H E
S
O F T W A R E
Reports Menu
40
4. Choose OK.
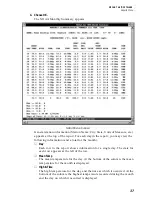
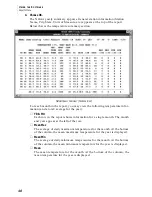
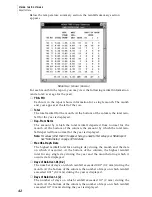
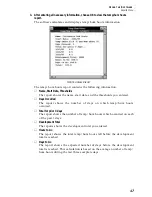
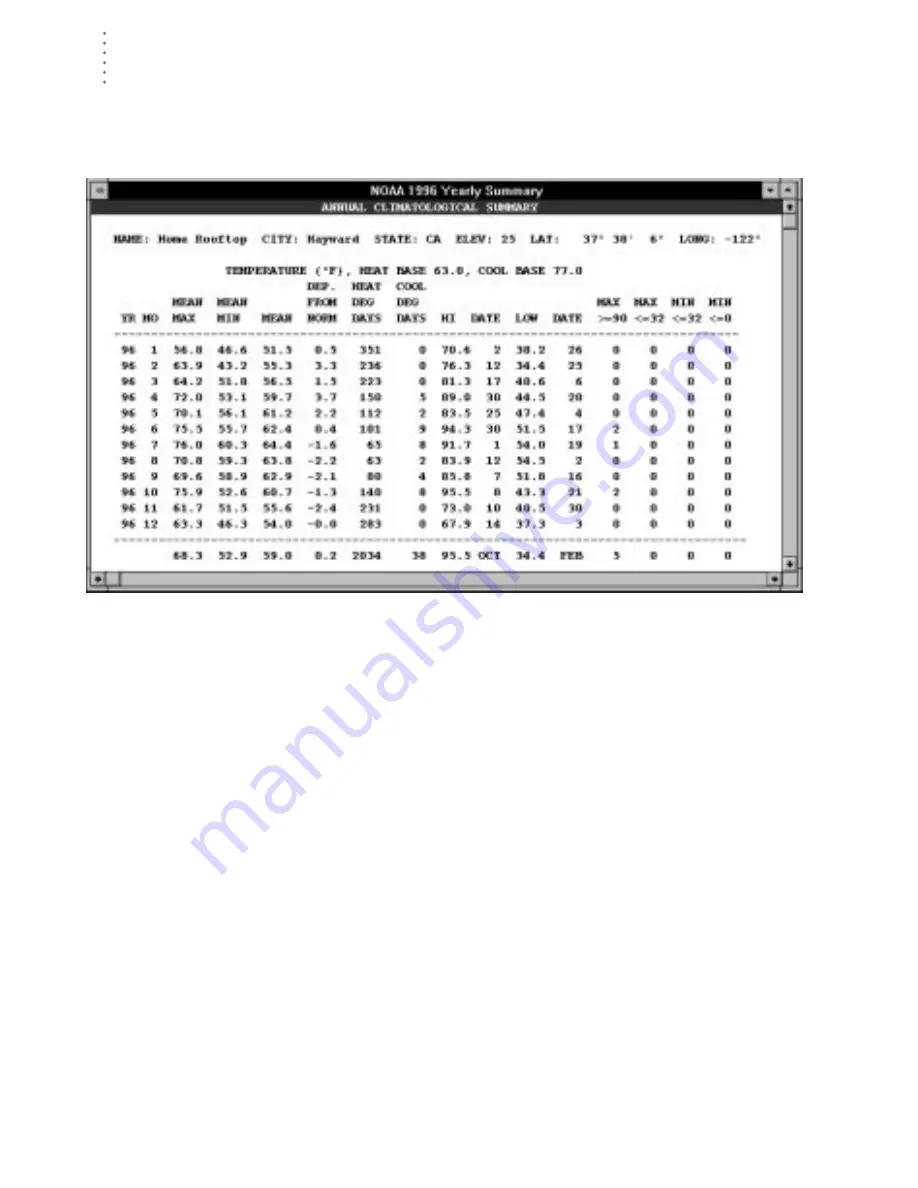
The NOAA yearly summary appears. General station information (Station
Name, City, State, Units of Measure, etc.) appears at the top of the report.
Below that is the temperature summary section.
NOAA Y
EARLY
S
UMMARY
(T
EMPERATURE
)
For each month in the report, you may view the following temperature infor-
mation (and a total/average for the year):
▲
YR & MO
Each row in the report shows information for a single month. The month
and year appear at the left of the row.
▲
Mean Max
The average of daily maximum temperatures for the month. At the bottom
of the column, the mean maximum temperature for the year is displayed.
▲
Mean Min
The average of daily minimum temperatures for the month. At the bottom
of the column, the mean minimum temperature for the year is displayed.
▲
Mean
The mean temperature for the month. At the bottom of the column, the
mean temperature for the year is displayed.

