U
S I N G
T H E
S
O F T W A R E
Reports Menu
42
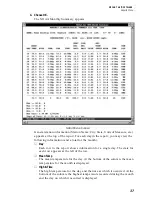
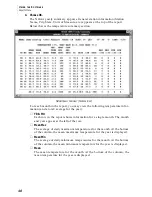
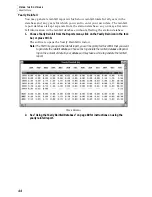
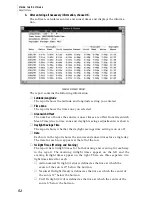
Below the temperature summary section, the rainfall summary section
appears.
NOAA Y
EARLY
S
UMMARY
(R
AINFALL
)
For each month in the report, you may view the following rainfall information
(and a total/average for the year):
▲
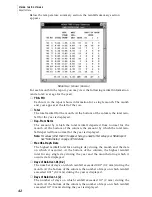
YR & MO
Each row in the report shows information for a single month. The month
and year appear at the left of the row.
▲
Total
The total rainfall for the month. At the bottom of the column, the total rain-
fall for the year is displayed.
▲
Dep. From Norm
The amount by which the total rainfall departed from normal for the
month. At the bottom of the column, the amount by which the total rain-
fall departed from normal for the year is displayed.
Note:
For values (other than 0) to appear here, you need to first setup your NOAA report.
See “NOAA Setup” on page 34 for details.
▲
Max Obs. Day & Date
The highest rainfall total for an single day during the month and the date
on which it occurred. At the bottom of the column, the highest rainfall
total for any single day during the year and the month during which it
occurred are displayed.
▲
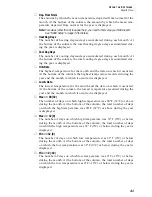
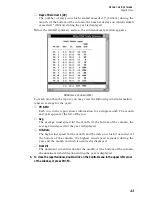
Days of Rain Over .01 (0.2)
The number of days on which rainfall exceeded 0.01" (0.2 mm) during the
month. At the bottom of the column, the number of days on which rainfall
exceeded 0.01" (0.2 mm) during the year is displayed.
▲
Days of Rain Over .1 (2)
The number of days on which rainfall exceeded 0.1" (2 mm) during the
month. At the bottom of the column, the number of days on which rainfall
exceeded 0.1" (2 mm) during the year is displayed.

