Sp
eedSp
y™
U
ser
’s & I
nstalla
tion M
anual
28
•
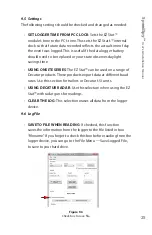
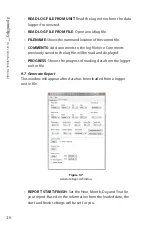
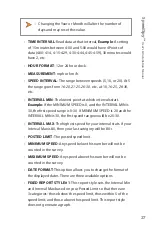
EXPORT DATA: > EXCEL
: Exports the raw data to Microsoft
Excel
®
. It will also generate a report and summary based on the
selections in Excel .
•
CHART SIZE
: Based on your computer settings, this allows for
various sizes of graphs for printing .
9.8 Generate Charts
9.8.1 Count vs. Speed
(Bar Graph):
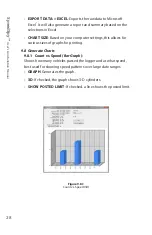
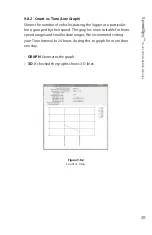
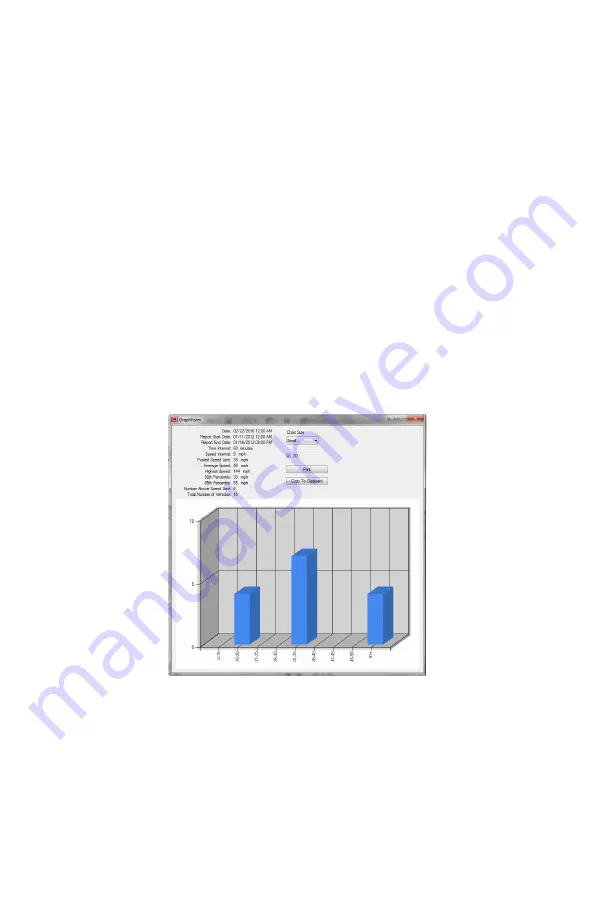
Shows how many vehicles passed the logger and at what speed,
best used for showing speed patterns over large date ranges .
•
GRAPH
: Generates the graph .
•
3D
: If checked, the graph shows 3-D cylinders .
•
SHOW POSTED LIMIT
: If checked, a line shows the posted limit .
Figure 9.8.1
Count vs . Speed (3D)


