47
Dell DVS Simplified Appliance Reference Architecture
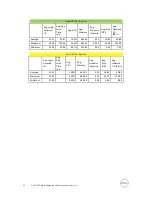
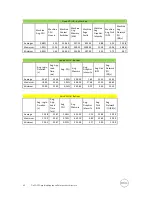
Good VDI UX - By User
Avg. Login
Duration
(s)
Avg. App
Load
Time (s)
Avg. CPU
Avg.
Memory
Avg.
Graphics
Intensity
Avg. Disk
IOPS
Avg.
Network
I/O
(KB/s)
Average
19.25
48.76
3.01%
899.95
40.57
8.29
94.59
Maximum
23.00
77.00
3.97%
951.54
55.75
24.81
133.00
Minimum
15.00
30.00
1.91%
707.62
4.73
5.54
13.00
Fair VDI UX - By User
Avg. Login
Duration
(s)
Avg.
App
Load
Time (s)
Avg.
CPU
Avg.
Memory
Avg.
Graphics
Intensity
Avg.
Disk
IOPS
Avg.
Network
I/O (KB/s)
Average
19.69
65.45
2.66%
841.99
19.51
32.66
66.64
Maximum
27.00
93.00
3.97%
956.14
46.70
42.98
107.00
Minimum
15.00
30.00
1.48%
706.81
4.76
13.61
14.00
7.3.2.2
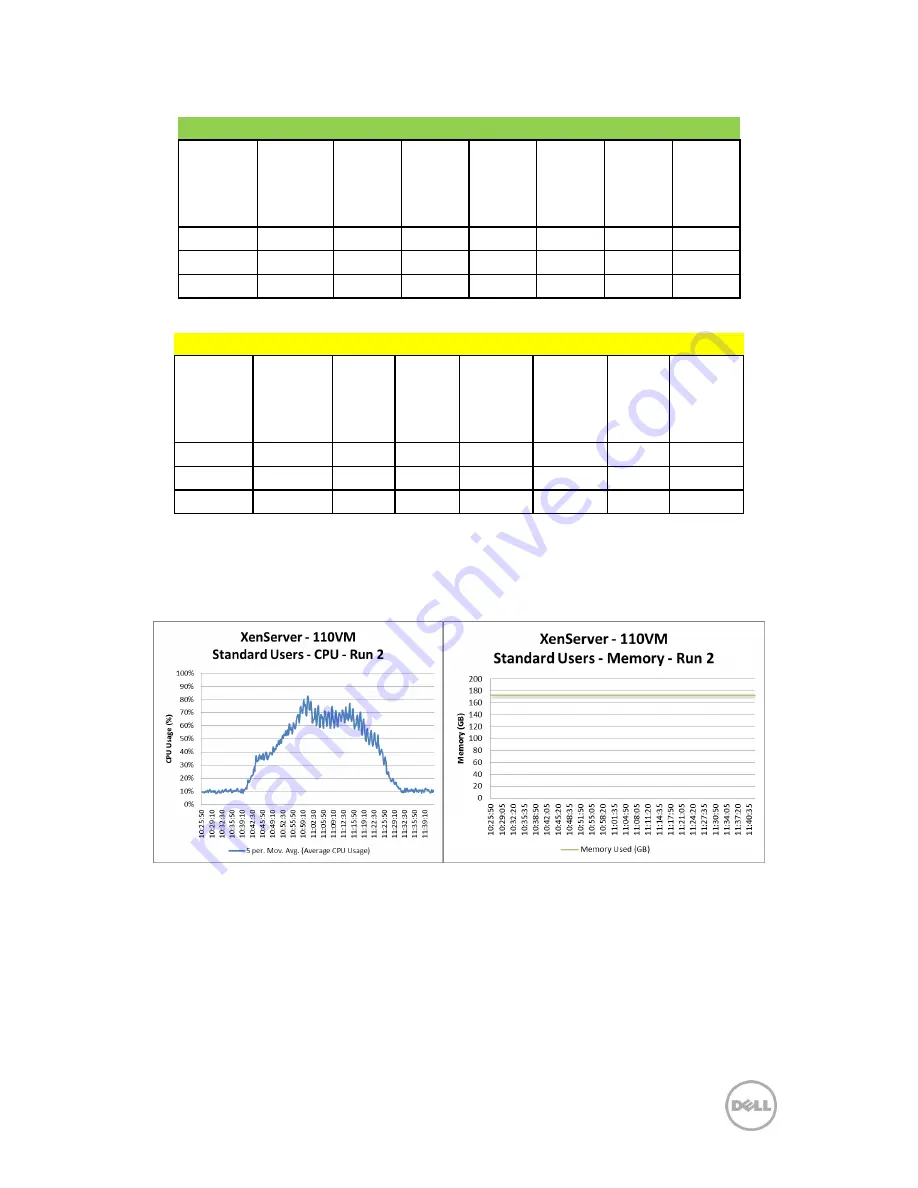
Test: Standard Run 2 (110 Users)
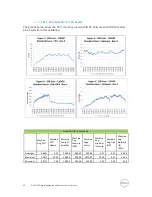
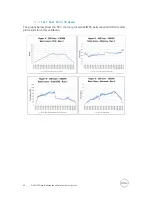
The graphs below show the CPU, memory, local disk IOPS, network and VDI UX scatter plot results from this
validation.


