51
Dell DVS Simplified Appliance Reference Architecture
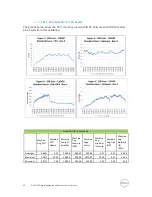
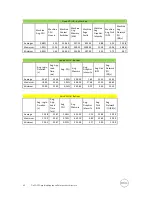
Good VDI UX - By Machine
Machine
Avg. CPU
Machine
CPU
Queue
Machine
Context
Switches
Machine
Avg.
Memory
(MB)
Machine
Page
Faults
Machine
Avg.
Graphics
Intensity
Machine
Avg. Disk
IOPS
Machine
Avg.
Network
I/O
(KB/s)
Averages
1.26%
1.22
472.24
798.80
1794.73
21.33
11.22
15.05
Maximum
1.53%
1.78
713.70
878.91
2521.68
46.34
17.17
34.04
Minimum
0.76%
1.00
218.28
719.77
1235.54
4.79
1.72
1.32
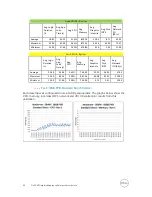
Good VDI UX - By User
Avg. Login
Duration
(s)
Avg. App
Load
Time (s)
Avg. CPU
Avg.
Memory
Avg.
Graphics
Intensity
Avg. Disk
IOPS
Avg.
Network
I/O
(KB/s)
Average
14.64
41.45
2.26%
939.78
51.53
20.25
51.82
Maximum
19.00
93.00
2.93%
1002.42
87.33
31.66
115.00
Minimum
10.00
15.00
1.80%
745.62
4.80
12.61
12.00
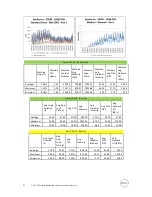
Fair VDI UX - By User
Avg. Login
Duration
(s)
Avg.
App
Load
Time (s)
Avg.
CPU
Avg.
Memory
Avg.
Graphics
Intensity
Avg.
Disk
IOPS
Avg.
Network
I/O (KB/s)
Average
17.08
91.33
2.71%
858.76
11.90
41.28
58.75
Maximum
20.00
93.00
3.97%
952.96
43.17
47.58
107.00
Minimum
14.00
88.00
2.28%
808.61
4.73
34.90
22.00

