56
Dell DVS Simplified Appliance Reference Architecture
7.3.3.3
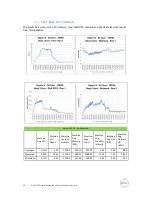
Test: Basic Run (70 Users)
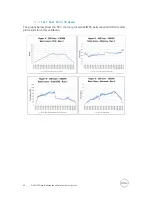
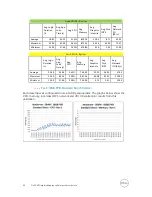
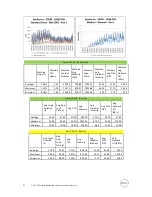
The graphs below show the CPU, memory, local disk IOPS, network and VDI UX scatter plot results
from this validation.
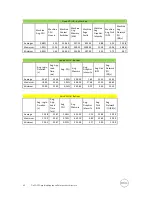
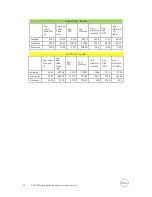
Good VDI UX - By Machine
Machine
Avg. CPU
Machine
CPU
Queue
Machine
Context
Switches
Machine
Avg.
Memory
(MB)
Machine
Page
Faults
Machine
Avg.
Graphics
Intensity
Machine
Avg. Disk
IOPS
Machine
Avg.
Network
I/O
(KB/s)
Averages
1.31%
4.53
223.04
552.56
597.51
6.82
3.20
9.85
Maximum
2.83%
10.64
451.00
609.91
2009.00
17.03
7.31
20.54
Minimum
0.73%
1.50
173.00
537.69
369.00
4.23
0.60
4.50

