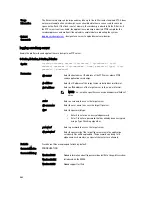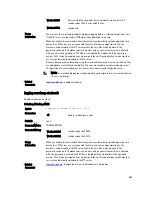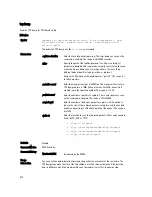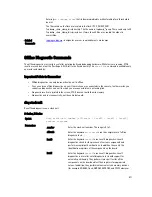
Version 7.8.1.0
Introduced on the S-Series.
show hardware stack-unit
Display the data plane or management plane input and output statistics of the designated component of the designated
stack member.
S-Series, Z-Series
Syntax
show hardware stack-unit
stack-unit
{cpu data-plane statistics
[stack-port
0-52
] | cpu i2c statistics | cpu party-bus
statistics | cpu sata-interface statistics | drops [unit
number
[port
0-27
]] | stack-port
0-52
| ti-monitor | unit
0-1
{counters | details | port-stats [detail] | register}}
Parameters
stack-unit
stack-
unit
{command-
option}
Enter the keywords
stack-unit
to select a particular stack
member and then enter one of the following command options to
display a collection of data based on the option entered. The Z9000
range is 0 to 7.
cpu data-plane
statistics
Enter the keywords
cpu data-plane statistics
, optionally
followed by the keywords
stack port
and its number, 0 to 52, to
display the data plane statistics, which shows the High Gig (
Higig
)
port raw input/output counter statistics to which the stacking module
is connected.
cpu i2c statistics
Z9000 only: Enter the keywords
cpu i2c statistics
to display
active i2c address statistics.
cpu party-bus
statistics
Enter the keywords
cpu party-bus statistics
, to display
the Management plane input/output counter statistics of the pseudo
party bus interface.
cpu sata-
interface
statistics
Z9000 only: Enter the keywords
cpu sata-interface
statistics
to display the sata interface error counter statistics.
drops [unit
0-1
[port
0-27
| no]]
Enter the keyword
drops
to display internal drops on the selected
stack member. Optionally, use the keyword
unit
with
0
or
1
to
select port-pipe 0 or 1, and then use
port
0-27
to select a port on
that port-pipe.
stack-port
0-52
S-Series only: Enter the keywords
stack-port
and a stacking port
number to select a stacking port for which to display statistics.
unit
0-3
{counters
| details | port-
stats [detail] |
register}
Enter the keyword
unit
followed by
0
or
3
and then enter one of the
following keywords to troubleshoot errors on the selected port-pipe
and to give status on why a port is not coming up to register level:
counters
,
details
,
port-stats [detail]
, or
register
.
TI monitor
S55 only: Enter the unit keyword to show information regarding the TI
register.
Defaults
none
582
Summary of Contents for Force10 Z9000
Page 1: ...FTOS Command Line Reference Guide for the Z9000 System FTOS 9 1 0 0 ...
Page 96: ...96 ...
Page 194: ...194 ...
Page 312: ...312 ...
Page 540: ...540 ...
Page 546: ...546 ...
Page 560: ...560 ...
Page 566: ...566 ...
Page 590: ...action act UpdateCounter param0 1 0x01 param1 0 0x00 output truncated 590 ...
Page 624: ...624 ...
Page 638: ...638 ...
Page 648: ...648 ...
Page 659: ...Related Commands show gvrp displays the GVRP configuration 659 ...
Page 660: ...660 ...
Page 834: ...834 ...
Page 854: ...854 ...
Page 906: ...906 ...
Page 914: ...914 ...
Page 976: ...976 ...
Page 990: ...990 ...
Page 1006: ...1006 ...
Page 1008: ...1008 ...
Page 1026: ...1026 ...
Page 1145: ...10 211 1 2 Outgoing interface list GigabitEthernet 8 0 1145 ...
Page 1146: ...1146 ...
Page 1156: ...1156 ...
Page 1166: ...1166 ...
Page 1180: ...1180 ...
Page 1258: ...1258 ...
Page 1272: ...1272 ...
Page 1394: ...1394 ...
Page 1400: ...1400 ...
Page 1410: ...1410 ...
Page 1424: ...1424 ...
Page 1444: ...1444 ...
Page 1468: ...Version 8 3 8 0 Introduced on the S4810 1468 ...
Page 1470: ...1470 ...

