Managed Resources | Resource Management
173
Managed Resources Expanded
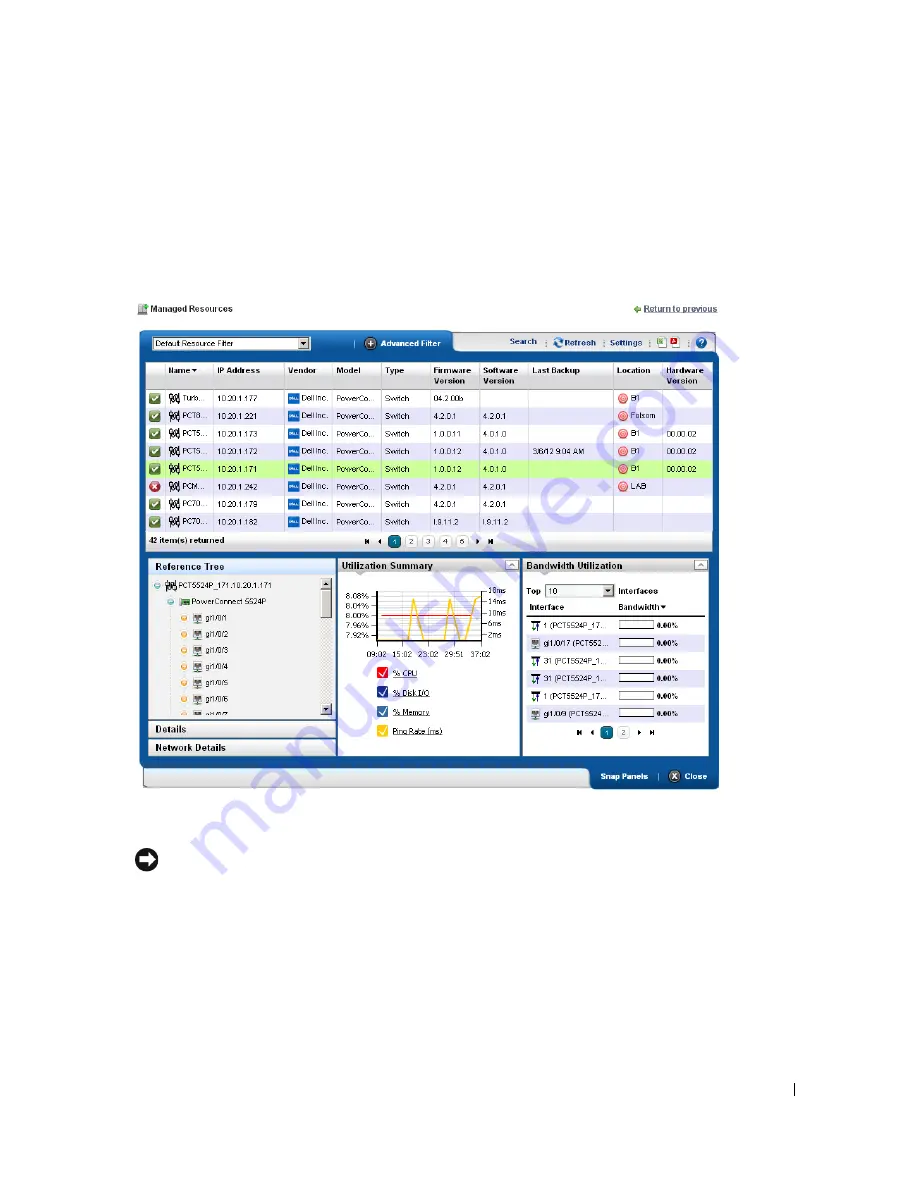
If you click the plus (+) in the upper right corner of the summary screen, this expanded screen
appears. As in all such screens, you can limit what appears listed with the filters at the top of the
screen. Select the filter from default, seeded filters with the pick list at the top left corner of the
screen. You can also create your own custom filter by clicking
Advanced Filter
to the right of this
pick list (see Filter Expanded Portlet Displays on page 85 for more).
The
Settings
button lets you configure the displayed columns and their order
.
Tip
You can select multiple devices by Ctrl+clicking them in the expanded portlet. This lets you do these
same tasks on more than one device. You can also perform such tasks on multiple devices with managed
resource groups. See Managed Resource Groups on page 162.
The following are available columns:
Network Status
—The network status of the device.
Alarm Severity
—The highest open alarm for the device.
Equipment Name
—The name of the device.
Summary of Contents for OpenManage Network Manager
Page 1: ...Dell OpenManage Network Manager version 5 1 Web Client Guide ...
Page 14: ...14 A Note About Performance Preface ...
Page 98: ...98 Schedules Portal Conventions ...
Page 142: ...142 Vendors Key Portlets ...
Page 232: ...232 File Management File Servers ...
Page 242: ...242 Deploy Configuration ...
Page 290: ...290 Key Metric Editor Monitoring Metrics This panel s display depends on the selected device ...
Page 340: ...340 ...
Page 374: ...374 Adaptive CLI Records Archiving Policy Actions and Adaptive CLI ...
Page 380: ...380 Glossary ...
Page 388: ...388 388 Index ...


