Dashboard Views | Monitoring
285
Other controls appear depending on the component type selected. These components
also have a
Monitor
control, a pick list where you can select from which monitor the
charted data originates. See Dial Chart Properties, Top Talkers Properties and Top Sub-
components Properties below for specifics about those.
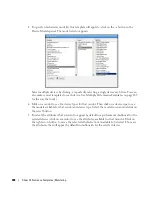
The line and bar components have two tabs under the general properties section:
Mon-
itor Targets
and
Attributes
. The Monitor Targets section lets you select the devices that
are sources of data. Click the
Add
button displays the monitor target selector.
6
The Attributes tab selects the attribute(s) that appear in the chart. If an attribute is a
composite, then its series appears in the Available Series listbox.
Select the desired series and click the right arrow to move them to the Selected Attributes
listbox.
If the attribute is not a composite, then nothing appears in the Available Series listbox. Here,
click the right arrow to move the attribute to the
Selected Attributes
listbox.
Dial Chart Properties
Dial charts have the following additional properties
Monitor
—Select which monitor the charted data comes from in the pick list.
Attribute
—The attribute to get data for.
Min / Max Value
—The minimum / maximum value on the dial.
Entity
—The monitor target to get the data for. Clicking on the + button brings up the entity
selector.
Top Talkers Properties
Top Talkers components have the following properties.
Monitor
—Select which monitor the charted data comes from in the pick list.
Attribute
—The attribute to get data for.
Max # of Entities—
The number of entities to display
Order
—Select either
Ascending
(Bottom n), or
Descending
(Top n).
Summary of Contents for OpenManage Network Manager
Page 1: ...Dell OpenManage Network Manager version 5 1 Web Client Guide ...
Page 14: ...14 A Note About Performance Preface ...
Page 98: ...98 Schedules Portal Conventions ...
Page 142: ...142 Vendors Key Portlets ...
Page 232: ...232 File Management File Servers ...
Page 242: ...242 Deploy Configuration ...
Page 290: ...290 Key Metric Editor Monitoring Metrics This panel s display depends on the selected device ...
Page 340: ...340 ...
Page 374: ...374 Adaptive CLI Records Archiving Policy Actions and Adaptive CLI ...
Page 380: ...380 Glossary ...
Page 388: ...388 388 Index ...


