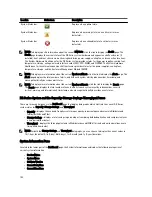
Location
Status Icon
Description
System Status bar
Represents an optimal state.
System Status bar
Represents a warning state (a non-critical error was
detected).
System Status bar
Represents an actionable state (a critical error was
detected).
NOTE: To display specific information about the current HW State, click the link to display the Health page. The
Health page displays the current status of the DR Series system hardware and expansion shelf enclosures (if
installed): front and rear chassis views, showing hard drive, power supply, cooling fan, and connection locations.
The System Hardware Health pane for the DR Series system provides status for the power supplies, cooling fans,
temperature, storage, voltage, network interface cards (NIC), CPU, DIMM, and NVRAM. The System Hardware
Health pane for the external expansion shelf enclosures provides status for the power supplies, cooling fans,
temperature, storage, and the Enclosure Management Module (EMM).
NOTE: To display more information about the current Number of Alerts, click the link to display the Alerts page. The
Alerts page displays the total number of alerts, and lists each system alert by index number, timestamp, and
message that briefly describes alert status.
NOTE: To display more information about the current Number of Events, click the link to display the Events page.
The Events page displays the total number of events, and lists each system event by index number, severity
(critical, warning, and informational), timestamp, and a message that briefly describes event status.
DR Series System and the Capacity-Storage Savings-Throughput Panes
There are three central panes in the Dashboard page that display data graphs which illustrate the current DR Series
system status for Capacity, Storage Savings, and Throughput:
•
Capacity—displays the used and free physical storage capacity in percentages and volume in Gibibytes and
Tebibytes (GiBs and TiBs).
•
Storage Savings—displays a total savings in percentages (combining both deduplication and compression) over
a time period (in minutes).
•
Throughput—displays the throughput volume in Mebibytes/second (MiB/s) for read and write operations over a
time period (in minutes).
NOTE: For both the Storage Savings and Throughput data graphs, you can choose to display the current values in
1h (1-hour, the default), 1d (1-day), 5d (5-days), 1m (1-month), and 1y (1-year) durations.
System Information Pane
Located in the lower part of the Dashboard page, the System Information pane displays the following categories of
current system information:
•
Product Name
•
System Name
•
Software Version
•
Current Date/Time
•
Current Time Zone
102
Summary of Contents for PowerVault DX6112
Page 1: ...Dell DR Series System Administrator Guide ...
Page 32: ...32 ...
Page 70: ...70 ...
Page 86: ...86 ...
Page 100: ...For more information on Replication schedules see Creating a Replication Schedule 100 ...
Page 114: ...114 ...

