•
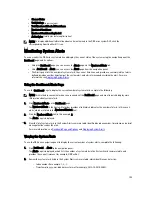
Cleaner Status
•
Total Savings (in percentage)
•
Total Number of Files in All Containers
•
Number of Containers
•
Number of Containers Replicated
•
Active Bytes (total bytes before optimization)
NOTE: To display additional information about certain elements in the DR Series system GUI, click the
corresponding Question Mark (?) icon.
Monitoring System Alerts
You can monitor the DR Series system alerts and display the current state of the system using the navigation panel, the
Dashboard page, and its options:
•
Using the Dashboard page, you can access the Alerts page via the Number of Alerts link.
•
Using Dashboard
→
Alerts, you can access the Alerts page from the navigation panel.
•
The Alerts page lists the number of system alerts, the current time zone, and provides a summary table of alerts
defined by index number, timestamp of the system alert, and a brief message describing the alert. For more
information, see
Displaying System Alerts
.
Using the Dashboard Alerts Page
To use the Dashboard page to display the current number of system alerts, complete the following:
NOTE: This method in convenient when you are already at the Dashboard page and want to quickly display more
information about system alerts.
1.
Click Number of Alerts on the Dashboard page.
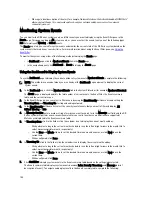
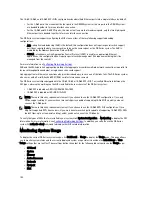
The Number of Alerts in the System Status bar provides a link (which indicates the number of alerts, in this case 2
alerts, which are listed in the Number of Alerts: 2 link).
2.
Click the Number of Alerts link (in this example, 2).
The Alerts page is displayed.
3.
View the list of system alerts in the System Alerts summary table, identified by index number, timestamp, and a brief
message that describes the alert.
For more information, see
Dashboard Page and Options
and
Displaying System Alerts
.
Viewing the System Alerts
To use the DR Series navigation panel to display the current number of system alerts, complete the following:
1.
Click Dashboard
→
Alerts in the navigation panel.
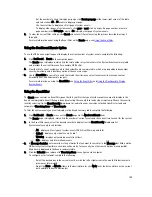
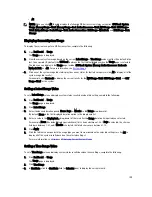
The Alerts page is displayed, which lists the number of system alerts in the System Alerts summary table, and
provides the current timezone (for example, US/Pacific).
2.
Review the system alerts listed in the System Alerts summary table, which identifies each alert by:
– Index number (for example: 1, 2, ...).
– Timestamp (in yyyy-mm-dd hh:mm:ss format; for example, 2012–10–30 10:24:53).
103
Summary of Contents for PowerVault DX6112
Page 1: ...Dell DR Series System Administrator Guide ...
Page 32: ...32 ...
Page 70: ...70 ...
Page 86: ...86 ...
Page 100: ...For more information on Replication schedules see Creating a Replication Schedule 100 ...
Page 114: ...114 ...

