– Set the number of events to display per page: click Events per page at the lower-right corner of the table
and select either 25 or 50 events to display per page.
– Use the scroll bar to display each full page of system events.
– To display other pages of system events, click prev or next, click on a specific page number, or enter a
page number in the Goto page and click Go to display that page of system events.
8.
To clear the current filter settings, click Reset and set new filter values using the process described in steps 3
through 6.
For more information about using the Event Filter on the Events page, see
Using the Event Filter
.
Using the Dashboard Events Option
To use the DR Series navigation panel to display the current number of system events, complete the following:
1.
Click Dashboard
→
Events in the navigation panel.
The Events page is displayed, which lists the total number of system events in the System Events summary table,
and provides the current timezone (for example, US/Pacific).
2.
View the list of current system events in the System Events summary table, which are grouped by index number,
severity, timestamp, and a brief description of the event message.
3.
Use the Event Filter to search for events that match the criteria you select (event severity, message content,
timestamp from, and timestamp to ranges).
For more information on using the Event Filter, see
Using the Event Filter
and
Using the Dashboard to Display
System Events
.
Using the Event Filter
The Events page contains an Event Filter pane that lets you filter the type of system events you want to display in the
Events summary table. Event filtering is done by selecting the severity level and using a timestamp. Choose the severity
level by selecting it in the Event Severity drop-down list, and refine your search by selecting specific start and end
setpoints in Timestamp from and Timestamp to.
To filter the system events you want to display in the Events summary table, complete the following:
1.
Click Dashboard
→
Events (or access the Events page via the Number of Events link).
The Events page is displayed, which lists the number of current events and the current time zone set for the system.
2.
In the Event Filter pane, select the desired severity to display from the Event Severity drop-down list.
System event severity levels include:
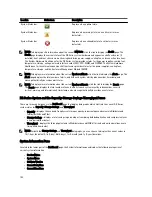
– All—displays all four types of system events (All, Critical, Warning, and Info)
– Critical—displays only critical events (in red)
– Warning—displays only warning events (in yellow)
– Info—displays only informational events
3.
In Message Contains, enter a word or string of words that you want to search for in the Message text field, and the
DR Series system will perform a case-insensitive match for your entry (no other search options are supported).
Matches are displayed in the Events summary table.
4.
Click the Calendar icon (adjacent to Timestamp From) to configure a start setpoint.
To configure a start setpoint, complete the following:
– Select the desired day in the current month, or click the left or right arrow in the month title bar to select a
previous or later month.
– Adjust the Hour and Minute sliders to the desired time (or click Now to set the date and time as the current
date and time in hours and minutes).
105
Summary of Contents for PowerVault DX6112
Page 1: ...Dell DR Series System Administrator Guide ...
Page 32: ...32 ...
Page 70: ...70 ...
Page 86: ...86 ...
Page 100: ...For more information on Replication schedules see Creating a Replication Schedule 100 ...
Page 114: ...114 ...


