Using the Statistics: Replication page, you can selectively filter and display specific types of related replication statistics
for all, one or more than one container, or one or more other peer DR Series systems.
For more information about Replication statistics, see
Displaying Replication Statistics
,
Container Filter
, and
Displaying
the Statistics: Replication Page
.
Displaying the Statistics: Replication Page
To display system replication container statistics for a selected container or another DR Series system, complete the
following:
1.
Click Dashboard
→
Statistics: Replication.
The Statistics: Replication page is displayed.
2.
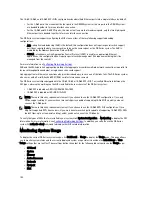
To select a container or another peer DR Series system, choose the appropriate Container Filter option.
– Click All to choose all of the replication containers.
– Click Name, press Ctrl, and select the containers in the list box to select one or more containers in the list
that you want to display.
– Click Peer System, press Ctrl, and select the peer systems in the list box to select one or more peer DR
Series systems in the list that you want to display.
NOTE: Only one of the Container Filter options can be active at any one time (they are mutually exclusive).
3.
Select the Header check box(es) for the replication statistics categories for which you want to filter and display in
the Replication Statistics summary table:
– Peer Status
– Replication Status
– Time to Sync
– Progress % (percentage)
– Replication Throughput
– Network Throughput
– Network Savings
– Last Sync in Time
– Peer Container
– Peer Status
NOTE: The following five types of replication statistics are enabled by default: Peer Status, Replication Status,
Network Throughput, Network Savings, and Progress %. If you choose more than five types of statistics
(when you select additional check boxes), a horizontal scroll bar appears at the bottom of the Replication
Statistics table. Use this scroll bar to display the columns of additional statistics that may not display within
the main window.
4.
Click Apply Filter to display the replication statistics types you selected to filter for your container or other peer DR
Series system choices.
The Replication Statistics summary table displays the replication statistics types you selected in the Replication
Filter pane.
To reset the default settings in the Replication Filter pane, click Reset.
To update the Replication Filter table after making a change, click Apply Filter to display an updated set of
replication statistics.
NOTE: Use the horizontal and vertical scroll bars to navigate through the columns of replication statistics
displayed in the Replication Statistics summary table.
112
Summary of Contents for PowerVault DX6112
Page 1: ...Dell DR Series System Administrator Guide ...
Page 32: ...32 ...
Page 70: ...70 ...
Page 86: ...86 ...
Page 100: ...For more information on Replication schedules see Creating a Replication Schedule 100 ...
Page 114: ...114 ...

