•
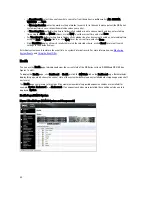
Using the Dashboard Alerts Page
•
Using the Dashboard Events Option
•
Using the Dashboard Page to Monitor System Health
•
Using the Dashboard to Display System Events
Understanding the Dashboard Options
The DR Series system provides a mechanism for viewing and accessing the latest information about the system as soon
as you log in. The Dashboard section of the navigation panel (which displays the Dashboard page by default) lists the
current system status and provides the following menu options, that when selected, display the corresponding pages:
•
Alerts
•
Events
•
Health
•
Usage
•
Statistics: Container
•
Statistics: Replication
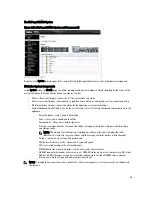
Displaying System Alerts
To display the Alerts page, click Dashboard
→
Alerts, or click the Number of Alerts link on the Dashboard page.
The Alerts page displays the Current Time Zone (for example, US/Pacific), the Number of Alerts, and a system alerts
summary table that lists the total number of system alerts by index number, timestamp, and a brief message that
describes the alert.
Unresolved critical events become system alerts, which will clear when the problem is resolved. For more information,
see
Monitoring System Alerts
.
Events
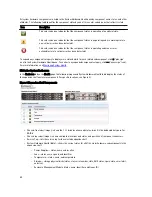
The DR Series system provides two ways to display current system events in the Events page:
•
Click Dashboard
→
Events .
•
Click Number of Events link on the Dashboard page.
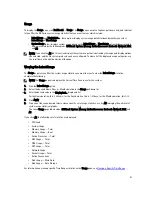
The Events page provides an Event Filter pane, which is where you can set specific search criteria based on selected
event severity, and starting and ending date setpoints. Once you set the search criteria, click Start Filter to display the
events matching your values.
Matching events are displayed in a Events summary table that lists the total number of system events that match the
search criteria you defined, and defines each matching system event by:
•
Index number
•
Event severity: critical, warning, or info (informational)
•
Timestamp
•
Message (brief description of system event)
In the Events page, set the search criteria for a specific system event type (or all recorded system events) based on the
following:
47
Summary of Contents for PowerVault DX6112
Page 1: ...Dell DR Series System Administrator Guide ...
Page 32: ...32 ...
Page 70: ...70 ...
Page 86: ...86 ...
Page 100: ...For more information on Replication schedules see Creating a Replication Schedule 100 ...
Page 114: ...114 ...

