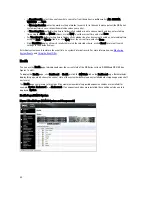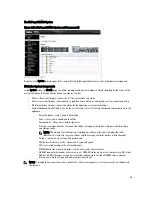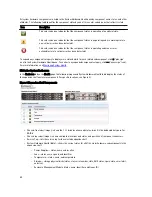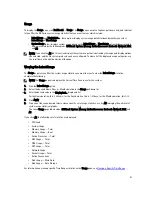
Viewing a Specific Time Range
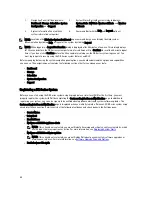
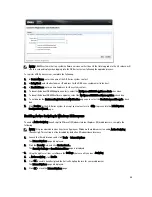
The Usage page lets you filter the system usage statistics you want to view. To view a specific Time Range, complete
the following:
NOTE: The Usage page also displays the Current Time Zone in use for the system.
1.
Click the Time Range option.
2.
Type the desired start date in Start Date (or click the calendar icon and make your date selection), or click Now to
select the current time (or use the Hour and Minute sliders to set a desired time), and click Done.
3.
Type the desired end date in End Date (or click the calendar icon and make your date selection), or select the Set
“End Date” to current time to set the end date to the current day and time, or click Now to select the current time
(or use the Hour and Minute sliders to set a desired time), click Done, and click Apply.
The seven Usage page tabs include: CPU Load, System, Memory, Active Processes, Protocols, Network, Disk, and
All.
If you click All, the following set of statistics are displayed:
•
CPU Load
•
System Usage
•
Memory Usage — Total
•
Memory Usage — Real
•
Active Processes — Total
•
NFS Usage — Total
•
CIFS Usage — Total
•
OST Usage — Total
•
Network Usage
•
Socket Usage — Total
•
Active Connections
•
Disk Usage — Meta Data
•
Disk Usage — Data Storage
For information on viewing the Latest Range statistics on the Usage page, see
Viewing the Latest Range
.
System Usage
This Usage page is where the DR Series system usage is displayed based on the Latest Time or Time Range values you
selected. System usage statistics are grouped and represented by the following tabs:
•
CPU Load
•
System
•
Memory
•
Active Processes
•
Protocols
•
Network
•
Disk
•
All
52
Summary of Contents for PowerVault DX6112
Page 1: ...Dell DR Series System Administrator Guide ...
Page 32: ...32 ...
Page 70: ...70 ...
Page 86: ...86 ...
Page 100: ...For more information on Replication schedules see Creating a Replication Schedule 100 ...
Page 114: ...114 ...

