21
o
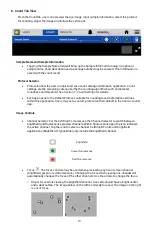
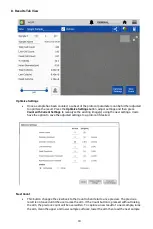
A color legend is included for the various histograms. Select up to 5 samples at a time to
chart.
o
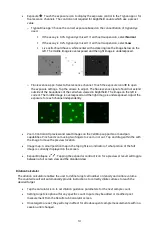
Graph Type Menu: Use the drop down to select additional graph types.
Graph Types
•
The graph types available are app dependent. Graphs may be expanded to full screen for
easier viewing using the expand/collapse button.
Graph showing totals only or with a cell size distribution histogram
•
Total Cell Count: Available for the Brightfield and GFP apps only.
•
Live Cell Count: Available for all apps except Brightfield.
•
Dead Cell Count: Available for Trypan Blue, PI, AO/PI and Yeast apps.
•
Live and Dead Cell Count: Available for Trypan Blue, PI, AO/PI and Yeast apps.
•
GFP+ Cell Count: Available for the GFP app only.
Additional Views
•
Cluster #: Available for all apps. Displays count of cell cluster sizes.
•
% Viability: Available for Trypan Blue, PI, AO/PI and Yeast apps.
Summary of Contents for CellDrop FL
Page 1: ...December 2019...

