User Manual DEV 1953
62
Copyright DEV Systemtechnik GmbH 2015-2017
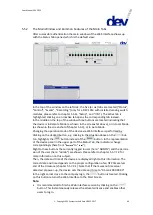
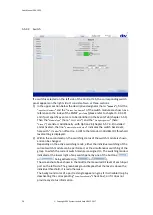
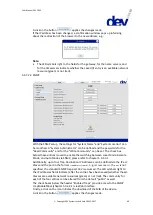
Note:
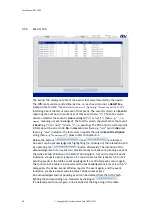
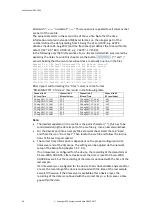
The recording interval and thus the recording duration can be altered, please
refer to chapter 5.5.7.3.1. The data representation initially always comprises
the recorded data for the selected items, i.e. it is stretched if the full recording
duration is not reached yet, and the graphs indicate via gaps if the device was
turned off for a span of time.
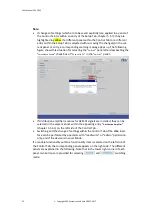
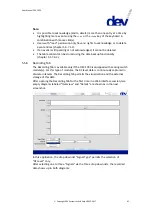
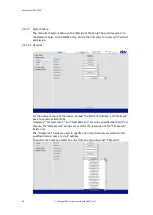
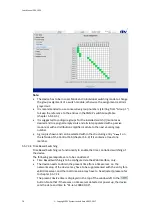
The checkbox labeled "Show Thresholds" enables the display of the related
present threshold for the selected signals. If checked, each threshold is shown
as a separate horizontal line with an individual label.
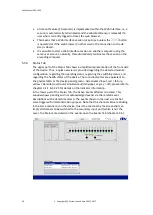
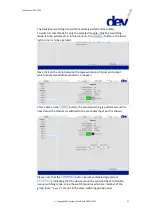
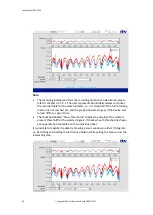
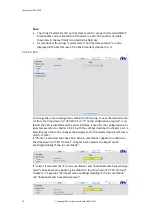
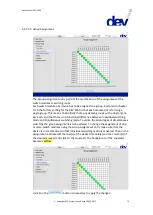
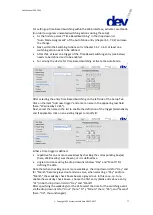
It is possible to magnify the data by drawing a zoom window in either (!) diagram,
i.e. by clicking and holding the left mouse button while pulling the mouse over the
interesting area:


