65 Aleksandar Stamboliyski Str., 8000 Bourgas, Bulgaria
Tel: +359 56 820027, Fax: +359 56 836700
E-mail: office@devabroadcast.com ,Web: www.devabroadcast.com
- 30 -
FFT
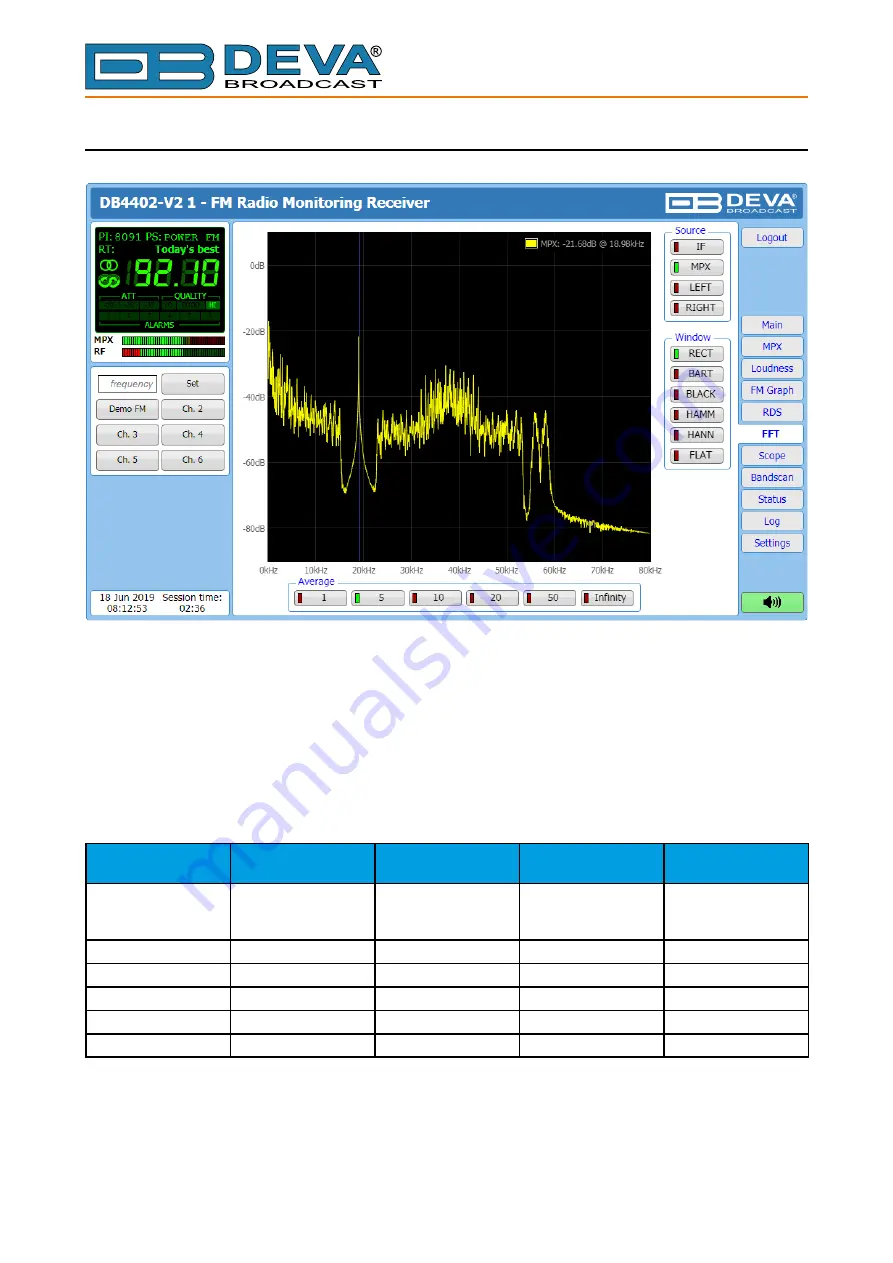
The spectrum analyzer tab is a very useful feature: It is a MPX and audio spectrum display.
Initially it shows the MPX from 0-65kHz so that the readings of the currently selected source
(composite MPX or stereo Left/Right) to be clearly visible. The signal source to be calculated
and visualized is chosen from the Source section placed on the right part of the screen. Spectral
components of the selected signal are determined on the base of Fast Fourier Transform.
The window function can be selected through the relevant menu with interactive buttons. The
available windows and their features are given below. This table can be used to choose the best
windowing function for each application.
Window
Best type for these
Signal Types
Frequency
Resolution
Spectral Leakage
Amplitude
Accuracy
Rectangle
Transient &
Synchronous
Sampling
Best
Poor
Poor
Barlett
Random
Good
Fair
Fair
Blackman
Random or mixed
Poor
Best
Good
Hamming
Random
Good
Fair
Fair
Von Hann
Random
Good
Good
Fair
Flat-top
Sinusoids
Poor
Good
Best
The visualized Spectrum waveform is equivalent of the average value of several measurements
which are defined in section “Average”. The radio frequency to be observed could be easily set by
using the preset buttons, placed on the left part of the screen.


