background image

Low and High Glucose Alerts


The ability of the System to detect high and low glucose levels is assessed by comparing System results to 
YSI results at low and high blood glucose levels and determining if the alert may have sounded. The System 
and YSI values were compared by pairing the System reading that occurred immediately after the YSI value 
was collected. We suggest that you ask your doctor what alert settings would be best for you. 

The Low Glucose Alert


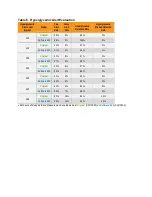
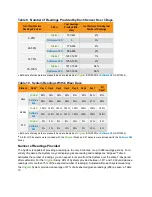
Estimates of how well the adjustable Low Glucose Alert performs are presented in Table 5. 

Hypoglycemia Alert Rate


The Alert Rate shows how often the alert is right or wrong. The True Alert Rate is the % of time the device 
alarmed when the blood glucose level was at or below the alert setting within 15 minutes before or after the 
device alarmed. The False Alert Rate is the % of time the device alarmed when the blood glucose level was 
above the alert setting within 15 minutes before or after the device alarmed. 

For example, if you set the Low Glucose Alert to 70 mg/dL and your alarm sounds, how often can you 
expect your blood sugar to actually be low? Based on the 

Original 

Study, if your alarm sounds, you can 

expect your blood sugar to be below 70 mg/dL approximately 79% of the time and not be below 70 mg/dL 
approximately 21% of the time within the 15 minute period before or after your alarm sounds. Based on the 

Software 505


Study, if your alarm sounds, you can expect your blood sugar to be below 70 mg/dL 

approximately 92% of the time and not be below 70 mg/dL approximately 8% of the time within the 15 
minute period before or after your alarm sounds. 

Hypoglycemia Detection Rate


The Detection Rate shows how often the device recognizes and alerts you to an episode of hypoglycemia or 
how often it misses such an event. The Hypoglycemia Detection Rate is the % of time the blood glucose 
level was at or below the alert setting and device alarmed within 15 minutes before or after the blood 
glucose was at or below the alert settings. The Hypoglycemia Missed Detection Rate is the % of time the 
blood glucose was at or below the alert setting, but the device did not alarm within 15 minutes before or 
after the blood glucose was at or below the alert setting. 

For example, if you set the Low Glucose alert to 70 mg/dL, how often will your alarm alert you if your blood 
glucose goes below 70 mg/dL? Based on the 

Original 

Study, if your blood sugar goes below 70 mg/dL, 

you can expect your alarm to sound 83% of the time and not to sound approximately 17% of time within 
the 15 minute period before or after your blood sugar goes below 70 mg/dL. Based on the 

Software 505


Study, if your blood sugar goes below 70 mg/dL, you can expect your alarm to sound 91% of the time and 
not to sound approximately 9% of time within the 15 minute period before or after your blood sugar goes 
below 70 mg/dL. 


Summary of Contents for G4 Professional

Page 1: ...Between the Lines Dexcom Inc 6340 Sequence Drive San Diego CA 92121 USA 1 858 200 0200 1 877 339 2664 www dexcom com 3 LBL012514 Rev X01 MT21686 Dexcom Inc P120005 180 Day Supplement Volume 8 Page 20...

Page 2: ...2 INDICATIONS FOR USE AND SAFETY STATEMENT 18 Dexcom G4 PLATINUM Continuous Glucose Monitoring System 2 Dexcom Inc P120005 180 Day Supplement Volume 8 Page 218 of 309 Confidential Do not disclose with...

Page 3: ...on troubleshooting your system and on the performance characteristics of the device 20 Dexcom G4 PLATINUM Continuous Glucose Monitoring System 2 2 3 CONTRAINDICATIONS _ Z Z and Receiver before Magnet...

Page 4: ...ge The sensor should not be stored in a freezer Storing the sensor improperly might cause the sensor 22 Dexcom G4 PLATINUM Continuous Glucose Monitoring System 2 glucose readings to be inaccurate and...

Page 5: ...an obstruction they might not communicate or the communication distance may be shorter and you might miss a low or high blood glucose value the USB cable is not attached If water gets into the 24 Dex...

Page 6: ...chapter fourteen TECHNICAL INFORMATION...

Page 7: ...linical studies the Original Receiver Software Study SW10050 and the Software 505 Receiver Software Study SW10505 Differences between the studies include the number of subjects enrolled the number of...

Page 8: ...ays Day 1 Day 4 and Day 7 of the 7 day wear period In the Software 505 Study subjects were evaluated in one of the three clinic days so there are fewer data samples than in the Original Study While us...

Page 9: ...fter the YSI was collected The agreement of the System to blood glucose value was assessed by calculating the percentage of System readings that were within 15 20 30 and greater than 40 of the YSI val...

Page 10: ...ot display glucose values below 40 mg dL or above 400 mg dL the comparisons to the actual blood glucose levels as determined by the YSI analyzer when CGM is classified as LOW or HIGH are included sepa...

Page 11: ...umber of Paired CGM YSI 40 6 48 37 7 1 0 0 0 0 0 0 155 40 60 4 49 36 11 1 0 0 0 0 0 0 512 61 80 0 22 51 24 1 0 0 0 0 0 0 781 81 120 0 2 17 66 13 1 0 0 0 0 0 1706 121 160 0 0 1 25 60 13 2 0 0 0 0 1492...

Page 12: ...01 250 0 0 0 0 0 16 70 13 1 0 0 376 251 300 0 0 0 0 0 2 16 61 14 7 0 281 301 350 0 0 0 0 0 0 2 28 59 10 1 229 351 400 0 0 0 0 0 0 0 4 47 45 5 152 400 0 0 0 0 0 0 0 0 20 38 42 45 Concurrence of System...

Page 13: ...n absolute percent difference is the average distance regardless if positive or negative between System readings and YSI values Accuracy measures in differences for both the Original and Software 505...

Page 14: ...2 4 0 4 11 4 8 6 Software 505 226 0 8 1 4 6 7 5 4 81 180 Original 3853 4 8 3 0 13 8 9 8 Software 505 738 3 9 4 1 9 6 8 2 181 300 Original 2784 2 1 0 0 11 9 9 2 Software 505 798 0 6 0 4 8 0 6 1 301 35...

Page 15: ...e period before or after your alarm sounds Based on the Software 505 Study if your alarm sounds you can expect your blood sugar to be below 70 mg dL approximately 92 of the time and not be below 70 mg...

Page 16: ...Detection Rate 55 Original 50 50 71 29 Software 505 71 29 68 32 60 Original 64 36 75 25 Software 505 85 15 83 17 70 Original 79 21 83 17 Software 505 92 8 91 9 80 Original 87 13 86 14 Software 505 95...

Page 17: ...of the time within the 15 minute period before or after your alarm sounds Hyperglycemia Detection Rate The Detection Rate shows how often the device recognizes and alerts you to an episode of hypergl...

Page 18: ...ftware 505 98 2 100 0 140 Original 94 6 97 3 Software 505 97 3 99 1 180 Original 92 8 97 3 Software 505 97 3 99 1 200 Original 92 8 97 3 Software 505 96 4 98 2 220 Original 91 9 95 5 Software 505 94 6...

Page 19: ...1068 65 77 91 4 Software 505 295 80 90 98 0 12 14 hours Original 17 65 76 82 12 Software 505 0 1 CGM readings are within 40 to 400 mg dL inclusive 2 Both sets of study data are presented and are label...

Page 20: ...le The average and median of the absolute percent differences are included in Table 8 showing consistent accuracy and sensor stability over the 7 day life of the sensor Precision of System Readings In...

Page 21: ...100 100 100 100 100 STD Original 5 3 9 8 10 3 11 8 Software 505 3 2 8 11 15 2 13 9 1 Both sets of study data are presented and are labeled as Original SW10050 or Software 505 SW10505 2 A total of 108...

Page 22: ...rovided between 1 497 and 1 992 valid glucose readings or more than 75 of the expected number of readings Adjusted within each system wear day the Software 505 System provided an average of 98 of all...

Page 23: ...ood glucose values is also characterized using paired System and SMBG results The System and SMBG values were compared by pairing the comparative SMBG value to a System glucose reading that occurred i...

Page 24: ...00 mg dL inclusive 2 Both sets of study data are presented and are labeled as Original SW10050 or Software 505 SW10505 For CGM 80 mg dL the differences in mg dL are included instead of percent differe...

Page 25: ...an SMBG values Adverse Events No serious adverse events or device related serious adverse events occurred during either study Mild or very slight skin irritation such as erythema or edema occurred in...

Reviews: