background image

4

Software Setup and Operation

Installation

1. Insert the supplied data logging software 

CD into the PC.

2. Double click the set up.exe file to launch 

the software installation program

3. Follow the installation wizard to complete 

the installation.

4. Upon successful installation, the “Data-

logger” software icon shortcut will be auto-

matically placed on your PC desktop.

5. To initiate the software, double click on 

the “Datalogger” software icon. An easy to 

follow user interface will display. A user 

guide can be produced by selecting the 

“Help” option followed by “contents” from 

the user interface.

6. Ensure the data logger is connected  

successfully before programming. 

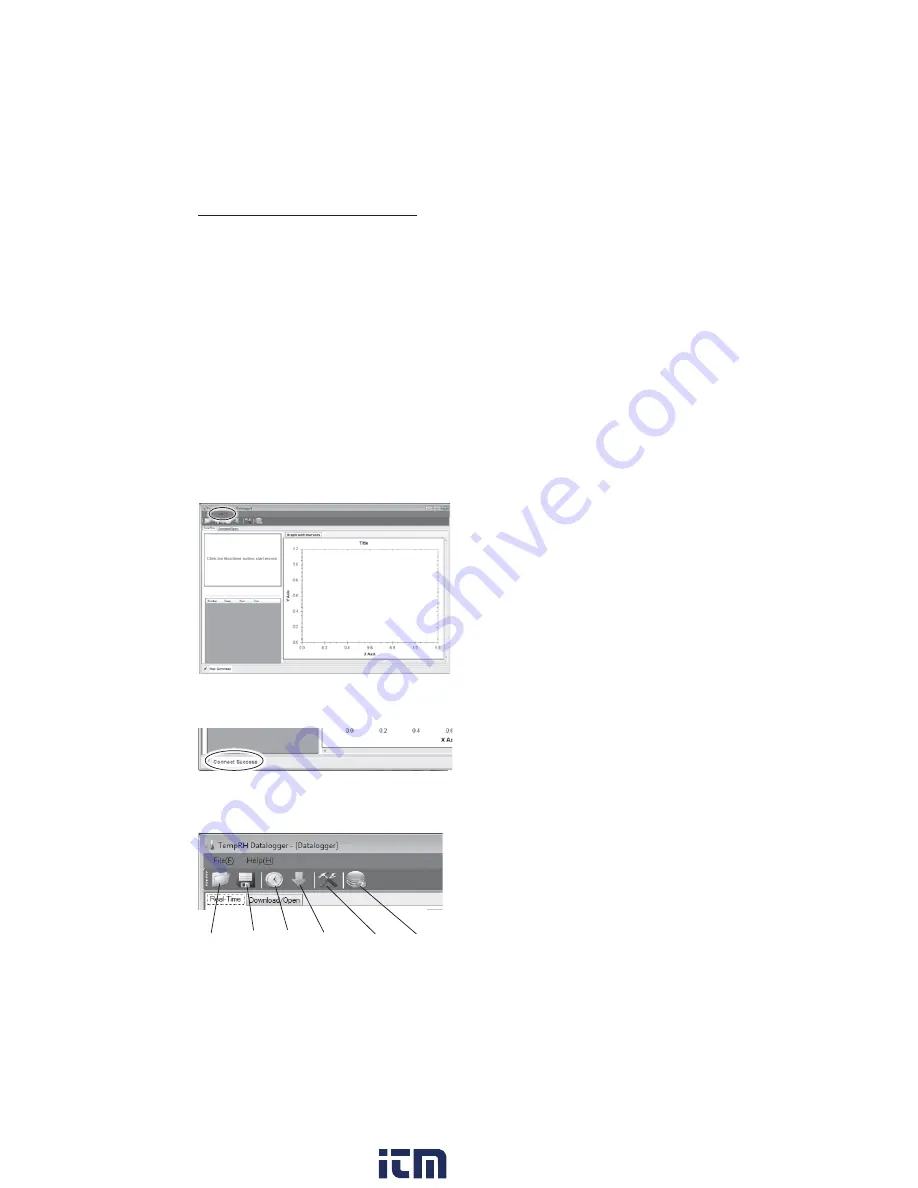
Open Function

Click on it to open previously logged data 

file for viewing or further analysis. When 

selected, the open screen will list data files 

saved earlier. Clicking on a file of interest 

will automatically load and display the data 

graph.

Save Function

Save logged data to a file for keeping or 

future analysis. When selected, the software 

will allow you to save the data in a default 

location or one of your choosing for access 

later through the open selection. The data 

can be saved in the default “.ITMR” format 

or “.CVS format”.

Real-time Function

Click on the clock icon to initiate data 

recording while the logger is still plugged 

into the computer USB port. This is particu-

larly useful when familiarizing yourself  

with the data logger by allowing you to 

immediately view the impact of changing 

the various settings. 

Download Function

Click on the arrow icon to download data 

currently saved in the data logger plugged 

into the computer USB port. When selected, 

the downloaded data will replace any data 

currently displayed.

Datalogger Setup Function

Click on the tool icon to set the start and 

logging mode and parameters of the data 

logger plugged into the computer USB port. 

This settings menu allows you to select the 

start mode, the sample rate and maximum 

sample points, the LED flash rate, alarm lev-

els, and temperature units. Once the set-

tings are selected, they are accepted by 

clicking on the setup button on the screen. 

This will also clear any stored data on the 

data logger so data of value should be 

saved before initiating a new setup.

Help Function

Click on it to download the user manual or 

find answers to data logger questions.

Open Save Real 

time

Down-

load

Data-

logger 

setup

Help

Functions

www.

.com

information@itm.com

1.800.561.8187

Summary of Contents for 20250-41

Page 1: ...User Manual THE STANDARD IN PRECISION MEASUREMENT Temperature and Temperature RH Data Loggers with USB Interface Models 20250 41 42 43 44 www com information itm com 1 800 561 8187 ...

Page 2: ...20250 44 4 Mounting clip with screws 5 Software CD 6 One 3 6 V battery 7 User manual Key Features Status indication via green and yellow red LEDs Integrated USB interface for setup and data download User settable high low alarms Real time mode lets you monitor and log measured data in real time while the logger is still plugged into the computer s USB interface Logger Description 1 Clear USB conne...

Page 3: ...couple sensor connected before recording LED Status Guide To conserve battery life increase the LED flashing cycle to 30 seconds using the provided software The LED status indication alternates every cycle For example If there is one alarm the REC LED blinks for one cycle and ALM LED will blink for next cycle When the battery is low all operations will be disabled automatically logged data will be...

Page 4: ...h the open selection The data can be saved in the default ITMR format or CVS format Real time Function Click on the clock icon to initiate data recording while the logger is still plugged into the computer USB port This is particu larly useful when familiarizing yourself with the data logger by allowing you to immediately view the impact of changing the various settings Download Function Click on ...

Page 5: ...de allows the logger to begin recording automatically once it is removed from the computer USB port Sample Rate set rate from 2 seconds to 24 hours between data samples Max Points select the number of samples up to 32 000 16 000 per channel Record Time calculates the run time based on sample rate and max points selected LED flash cycle increase the flash cycle to conserve battery life See LED Stat...

Page 6: ...only has an immediate start mode which is initi ated by clicking on the clock icon in the upper left of the display screen After a few seconds the real time tem perature and RH readings measured by the logger will show in the upper left quadrant of the display and the logged data will show in the lower left sector of the screen The graphic display will show the measured temperature trend Data in t...

Page 7: ...while moving the mouse to a central location on the graph Graphing Options Clicking on words Graph with markers toggles between adding or removing markers at each data point To return to the original view right mouse click anywhere in the graph and click on Set scale to default from the pull down menu Other options available on the pull down menu allow you to copy or save the graphic image print a...

Page 8: ...llowed by 70 to 90 F 20 to 30 C at 74 RH for 48 hours for rehydration If permanent damage to the internal sensor is suspected replace the data logger immediately Battery Replacement With a pointed object e g small screwdriver open the casing Gently pull off the casing and replace the 3 6 V lithium battery The two LED indicators will briefly light up alternating green yellow green Slide the logger ...

Reviews: